

Prior Trading Day Summary
On Mon Oct 12 2026 stock indexes saw low volume thanks partly to Columbus Day and bonds not trading along with preparation for bank earnings which start on Tuesday.
The SPX lost just 4 points to close at 7807. Volume was just 4.2 billion shares with new 52 week lows at 166 and new highs at 52. 50% of all volume was being traded higher and 46% of all stocks closed higher.
The NASDAQ fell 120 points to close at 27,245. Volume was also low at 6.6 billion shares traded. New lows rose to 400 and new highs rose to 86. 59% of all volume was being traded lower and by the close 59% of all stocks were lower.
Let’s review the closing technical indicators from Mon Oct 12 2026 to see what they predict for Tue Oct 13 2026.
Stock Market Outlook: SPX Closing Chart For Mon Oct 12 2026
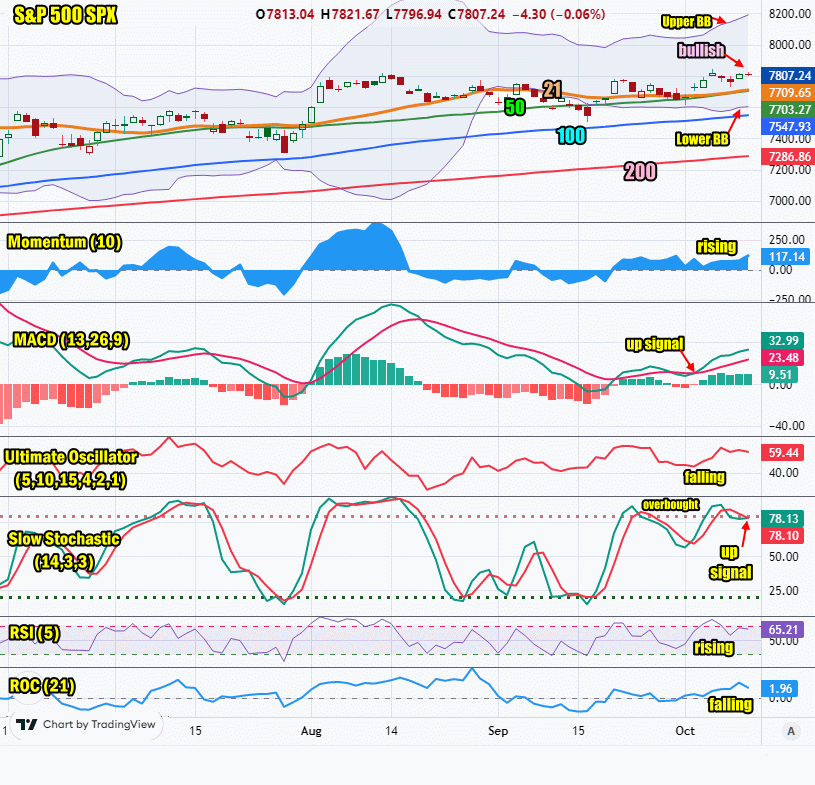
The index ended the day below the Upper Bollinger Band but above the 21 day moving average for a sixth straight day. This is bullish.
The closing candlestick is bullish for Tuesday.
The 21 day moving average is rising and closed at 7709. This is bullish.
The 50 day moving average is rising and closed at 7703. This is bullish.
The 100 day moving average is rising and closed at 7547. This is bullish.
The 200 day moving average is rising and closed at 7286. This is bullish.
The Lower Bollinger Band is below the 50 day moving average and moving sideways which is bearish. The Upper Bollinger Band is rising which is bullish.
The SPX chart is more bullish that bearish.
SPX Stock Market Outlook review of Mon Oct 12 2026
Stock Market Outlook: Technical Indicators Review
Momentum: Momentum is rising and positive. This is bullish.
|
MACD Histogram: MACD (Moving Averages Convergence / Divergence) issued an up signal on MonOct 5 2026. The up signal was stronger on Mon Oct 12 2026.
|
Ultimate Oscillator: The Ultimate Oscillator is falling.
|
Slow Stochastic: The Slow Stochastic has a weak up signal in place and is overbought. This is bullish.
|
Relative Strength Index: The RSI signal is rising. This is bullish.
|
| Rate of Change: The rate of change is falling, signaling that Tuesday will end lower. Settings: Rate Of Change is set for a 21 period. This indicator looks back 21 days and compares price action from the past to the present. With the Rate Of Change, prices are rising when signals are positive. Conversely, prices are falling when signals are negative. As an advance rises, the Rate Of Change signal should also rise higher, otherwise the rally is suspect. A decline should see the Rate Of Change fall into negative signals. The more negative the signals the stronger the decline. |
Stock Market Outlook: Support and Resistance Levels |
| 7850 is resistance |
| 7825 is resistance |
| 7800 is resistance |
| 7780 is resistance |
| 7750 is resistance |
| 7700 is resistance |
| 7650 is resistance |
| 7600 is support |
| 7570 is support |
| 7550 is support |
| 7500 is support |
Stock Market Outlook for Tue Oct 13 2026
With bank earnings being released before the open, the morning will be dominated by those earnings. Strong earnings beats will assist the bank stocks to move higher, in general. Weak or earnings that just meet estimates will see the bank stocks and the market in general dip lower. I am not expecting any kind of large sell-off or large rally. Investors though are pinning a lot of their outlook on the bank earnings as we start into the next quarterly earnings results. These bank earnings will take us through the fall and December trading period. A lot of investors are holding capital back wondering how bank stocks will perform today and this week.
For Tuesday watch the bank earnings reports and then market direction and action. I am expecting a choppy day and a good chance for bank stocks to dip before moving back up. In general bank earnings over the past several quarters have beaten estimates and sometimes banks have pulled back before moving higher again. On Tuesday the technical indicators are supporting a move higher but it depends on the opening earnings move for the market once we get bank results.
Potential Economic and Political Market Moving Events
Monday:
No reports
Tuesday:
6:00 NFIB Index of Small Business Optimism for Sep is estimated to slip to 98 from 98.7 prior
10:00 Existing home sales for Sep is estimated to remain unchanged at 4 million
2:00 Monthly Treasury Balance for Sep is estimated to rise to -29 billion from -167 billion prior