

Prior Trading Day Summary
On Mon Nov 2 2026 stocks opened higher and tried to build on the early rally. But as explained in yesterday’s outlook, the bounce on Monday would have a hard time holding its gains with the mid-terms ahead. The S&P and NASDAQ lost their gains and ended the day lower. After hours Apple released strong earnings that failed to excite investors. After hours they sold the stock lower. On the other hand Palantir Tech Stock (PLTR) rose after hours when they reported stellar results that beat all estimates and saw them raise their outlook. After earnings were released a number of analysts raised their outlook for the stock to $225 to $250 depending on the analyst.
The S&P closed down 38 points to end the day at 7541 now just 40 points before reaching the 7500 valuation. Volume was 5.8 billion shares traded with 62% of all volume being traded higher. New highs were 81 and new lows fell to 96 from Friday’s 169.
The NASDAQ which was higher early in the day, ended down 272 points at 25,164. The chance of the index falling below 25,000 is quite high. The NASDAQ has not been this low since May. Over the past two days the index has lost 1019 points. Volume was 9.5 billion with 51% of stocks falling by the close. There were 148 new 52 week highs which is better than any day since October 6. New lows were 422 which is still a very bearish number.
Let’s review the closing technical indicators from Mon Nov 2 2026 to see what they predict for Tue Nov 3 2026.
Stock Market Outlook: SPX Closing Chart For Mon Nov 2 2026
The index ended the day below the Upper Bollinger Band and the 21, 50 and 100 day moving averages. This is very bearish.
The closing candlestick is bearish for Tuesday but points to a probable second bounce attempt.
The 21 day moving average is falling and closed at 7720. This is bearish.
The 50 day moving average is falling and closed at 7694. This is bearish.
The 100 day moving average is falling and closed at 7583. This is bearish.
The 200 day moving average is rising and closed at 7345. This is bullish.
The Lower Bollinger Band is below the 21 and at the 50 day moving average and closed at the 100 day. This is very negative for stocks. The Upper Bollinger Band is rising which is bearish until the Lower Bollinger Band changes direction.
The SPX chart is bearish for Nov 3 2026.
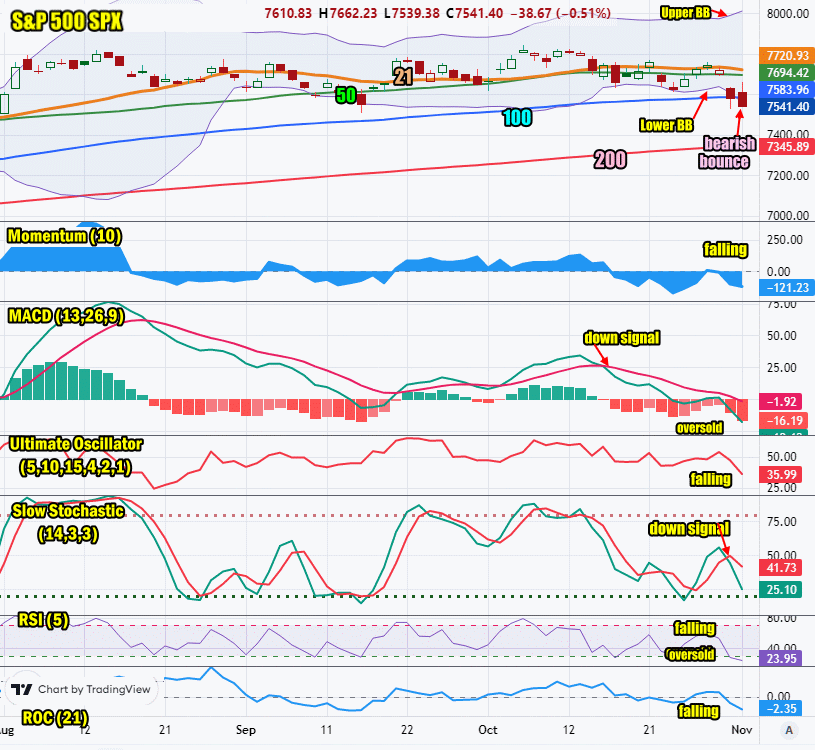
SPX Stock Market Outlook review of Mon Nov 2 2026
Stock Market Outlook: Technical Indicators Review
Momentum: Momentum is falling and negative. This is bearish. At a reading of -121.23 the indicator is becoming oversold.
|
MACD Histogram: MACD (Moving Averages Convergence / Divergence) issued a down signal on Thu Oct 15 2026. The down signal was stronger on Monday and is entering readings which are normally oversold indicators.
|
Ultimate Oscillator: The Ultimate Oscillator is falling which is bearish.
|
Slow Stochastic: The Slow Stochastic has a down signal in place which is bearish. It is also at oversold readings.
|
Relative Strength Index: The RSI signal is falling which is bearish. It is very oversold.
|
| Rate of Change: The rate of change is falling signaling that Tuesday will end lower.
Settings: Rate Of Change is set for a 21 period. This indicator looks back 21 days and compares price action from the past to the present. With the Rate Of Change, prices are rising when signals are positive. Conversely, prices are falling when signals are negative. As an advance rises, the Rate Of Change signal should also rise higher, otherwise the rally is suspect. A decline should see the Rate Of Change fall into negative signals. The more negative the signals the stronger the decline. |
Stock Market Outlook: Support and Resistance Levels |
| 7800 is resistance |
| 7780 is resistance |
| 7750 is resistance |
| 7700 is resistance |
| 7650 is resistance |
| 7600 is resistance |
| 7570 is support |
| 7550 is support |
| 7500 is support |
Stock Market Outlook for Tue Nov 3 2026
For Tuesday stocks are facing declining oil prices which are a good sign but the mid-terms which presents an unknown outcome. The closing candlestick points to a second bounce attempt as being possible but they may not occur today ahead of the mid-term election results.
Watch for Apple to pullback today and Palantir Tech Stock (PLTR) to move higher. The day will be choppy with a negative close. The technical indicators are becoming oversold which may mean a bounce on Wednesday or Thursday. The SPX looks ready to fall to the 7500 level. We could see that happen today or tomorrow. That may bring in some buyers but for now buy ere are taking a wait-and-see approacvh.
Potential Economic and Political Market Moving Events
Monday:
9:45 Manufacturing PMI for Oct was lower than estimated, coming in at 54.9
10:00 Construction spending for Sept was much lower than estimated coming in negative at -1.5%
Tuesday:
Mid-Terms
10:00 Job openings and Labor Turnover for Sep is estimated at 7.1 million
10:00 Factory orders for Sep are estimated to jump to 1.3% from 0.1% prior. This would be a strong showing for the economy.