

Prior Trading Day Summary
On Fri Oct 30 2026 stocks plunged as the ai trade took another hit. Tech stocks took the brunt of the sell-off which saw the S&P lose 140 points for a drop of 1.82% and a close at 7580. This was the worst single day since June 5 when the index lost 200 points to close at 7383. The media has a field day on Friday but for the week the index was only down 43 points and still above the 7500 valuation. As investors know, since August the technical tools have continued to advise that the index could test the 7500 support level. On Friday volume was up just 300 million shares to 6.2 billion and new lows jumped to 169. 64% of all volume being traded was moving lower and 62% of stocks were falling. You can see from the stats that while Friday was a major sell-off, the SPX did not face the brunt of the sell-off.
The NASDAQ however saw volume jump 1.6 billion shares with a drop of 747 points to close at 25437. Keeping things in perspective, the NASDAQ lost 694 points on Oct 22 and 572 points on Oct 16 and 511 points on Oct 14. 75% of the volume traded was moving lower by the close and 73% of all stocks were falling on the index. This matches Oct 16 and Oct 14 sell-offs. For the week the NASDAQ lost 518 points which was far less than the second week loss of 1226 points. Looking back to May the NASDAQ has struggled repeatedly to break higher. It has continually moved above 26000 and 27000 only to move back below both a number of times. Studying market breadth you can see that the NASDAQ has been unable to build strength throughout the summer and now heading into the fall the outlook has not changed.
Let’s review the closing technical indicators from Fri Oct 30 2026 to see what they predict for the start of November and the mid-terms.
Stock Market Outlook: SPX Closing Chart For Fri Oct 30 2026
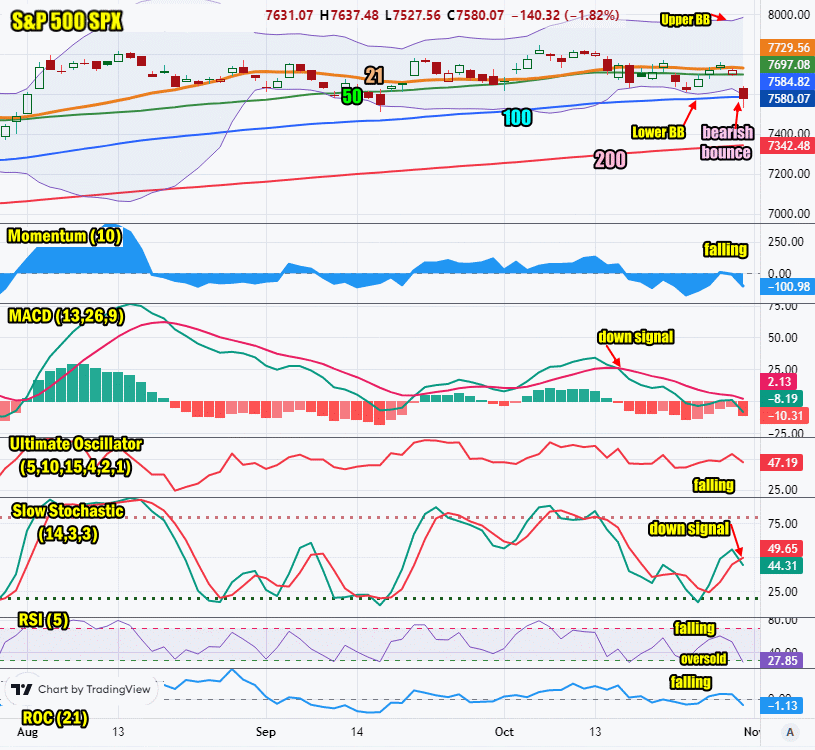
The index ended the day below the Upper Bollinger Band and the 21 and 50 day moving averages. The index fell below the 100 day but managed to bounce back to close at the 100 day. This is bearish.
The closing candlestick is bearish for Monday but points to a strong possibility of a bounce.
The 21 day moving average is falling and closed at 7729. This is bearish.
The 50 day moving average is falling and closed at 7697. This is bearish.
The 100 day moving average is unchanged and closed at 7584. This is bearish.
The 200 day moving average is rising and closed at 7342. This is bullish.
The Lower Bollinger Band is below the 21 and at the 50 day moving average which is negative for stocks. The Upper Bollinger Band is sideways which is neutral.
The SPX chart is more bearish than bullish for the start of November.
SPX Stock Market Outlook review of Fri Oct 30 2026
Stock Market Outlook: Technical Indicators Review
Momentum: Momentum is falling and negative. This is bearish.
|
MACD Histogram: MACD (Moving Averages Convergence / Divergence) issued a down signal on Thu Oct 15 2026. The down signal was stronger on Friday and signals more downside ahead.
|
Ultimate Oscillator: The Ultimate Oscillator is falling which is bearish.
|
Slow Stochastic: The Slow Stochastic has a down signal in place which is bearish.
|
Relative Strength Index: The RSI signal is falling which is bearish. It is oversold.
|
| Rate of Change: The rate of change is falling signaling that Monday will end lower.
Settings: Rate Of Change is set for a 21 period. This indicator looks back 21 days and compares price action from the past to the present. With the Rate Of Change, prices are rising when signals are positive. Conversely, prices are falling when signals are negative. As an advance rises, the Rate Of Change signal should also rise higher, otherwise the rally is suspect. A decline should see the Rate Of Change fall into negative signals. The more negative the signals the stronger the decline. |
Stock Market Outlook: Support and Resistance Levels |
| 7800 is resistance |
| 7780 is resistance |
| 7750 is resistance |
| 7700 is resistance |
| 7650 is resistance |
| 7600 is resistance |
| 7570 is support |
| 7550 is support |
| 7500 is support |
Stock Market Outlook for Mon Nov 2 2026
On Friday the selling in tech names was intense at times which pressured the technical indicators to all turn negative. The Relative Strength Index (RSI) signaled oversold and with all the technical indicators bearish, a bounce is likely.
With stocks heavily oversold, a bounce is highly likely even if the index slips in the morning back below the 100 day.
With the elections on Tuesday we could see a higher close today and a lower day on Tuesday. The biggest problem still facing many stocks is they are overvalued by most measures and unless investors are willing to push them higher in anticipation of increased earnings, stocks won’t climb. That could mean a lower month in November. Since May and June markets have not performed well while most corporate earnings continued to grow. This is typical of a topping action. It doesn’t mean a new bear market is emerging but it does warn that building cash reserves is important as we head into the late fall. Markets will see more trading of stocks as bounces will be used to take profits and dips to buy back into stocks. It may take weeks or the rest of the year for stocks to basically rebalance their valuations against expectations and actual earnings. For many investors this could be an excellent opportunity to look at covered calls for existing stock holdings while stocks churn.
On Monday watch for a bounce but use it to take profits and wait for more selling to setup trades. If interested in covered calls the bounce could be an opportunity to get started. I always caution to start with small positions and add to them as markets dictate. Back in June when the SPX sold off I thought the 7500 level would be tested. It was not. I could be wrong yet again but back then I wrote that the SPX had to break to new ground and continue building higher. That did not happen and we may see the SPX reach the 7500 in the present sell-off. For the SPX it is not that far to fall after Friday’s drop.
Potential Economic and Political Market Moving Events
Monday:
9:45 Manufacturing PMI for Oct is estimated to rise to 56 from 55.9 prior
10:00 Construction spending for Sept is estimated to fall to 0.4% from 0.9% prior
Tuesday:
Mid-Terms