

FullyInformed.com
Generic filters

Stock Market Outlook For Fri Jul 24 2026 – Potential Bounce Attempt But Lower Close

Jul 24, 2026 | Stock Market Outlook

Potential Bounce But Lower


Prior Trading Day Summary

On Thu Jul 23 2026 stocks fell after disappointing earnings from the likes of Alphabet Stock (GOOGL) and other companies combined with rising oil prices to push investors into a sell-off day.

Numbers were underwhelming in general and the indexes closed lower.

The SPX lost 90 points to close at 7408 on rising volume of 5.5 billion. By the close 71% of stocks were falling.

The NASDAQ lost 553 points to 25,137. Volume was 7.8 billion shares traded. The close saw 69% of stocks falling.

After hours on Thursday Intel earnings surprised with exceptional quarterly earnings.

Let’s review the closing technical indicators from Thu Jul 23 2026 to see what to expect for Fri Jul 24 2026.


Stock Market Outlook: SPX Closing Chart For Thu Jul 23 2026 

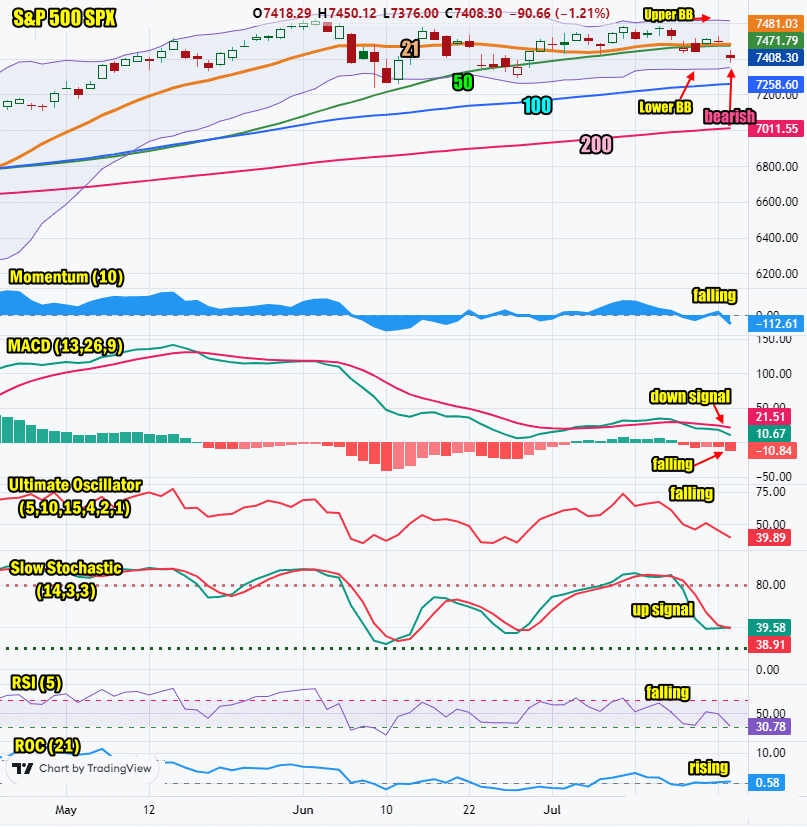
The index ended the day below both the 21 day and 50 day moving averages which is bearish.

The closing candlestick is bearish for Friday but with long shadows top and bottom which signals indecision on the part of investors. Dips are likely again on Friday.

The 21 day moving average is rising and closed at 7481. It is nearing the 50 day moving average.This is bearish.

The 50 day moving average is unchanged and closed at 7471. This is bearish.

The 100 day moving average is rising and closed at 7258. This is bullish.

The 200 day moving average is rising and closed at 7011. This is bullish.

The Lower Bollinger Band is rising. The Upper Bollinger Band is falling. The Bollinger Bands Squeeze is ending with signals pointing to stocks moving lower.

The SPX chart is more bearish than bullish for Fri Jul 24 2026.
SPX Stock Market Outlook review of Thu Jul 23 2026


Stock Market Outlook: Technical Indicators Review

Momentum: Momentum is falling and negative. This is bearish.

  • Settings: For momentum I use a 10 period when studying market direction.
MACD Histogram: MACD (Moving Averages Convergence / Divergence) issued a down signal on Fri Jul 17 2026. On Thu Jul 23 2026 the down signal gained strength.

  • Settings: For MACD Histogram, I am using the Fast Points set at 13, Slow Points at 26 and Smoothing at 9.
Ultimate Oscillator: The Ultimate Oscillator is falling which is bearish.

  • Settings: The Ultimate Oscillator settings are: Period 1 is 5, Period 2 is 10, Period 3 is 15, Factor 1 is 4, Factor 2 is 2 and Factor 3 is 1. These are not the default settings but are the settings I use with the S&P 500 chart set for 1 to 3 months.
Slow Stochastic: The Slow Stochastic has a weak up signal in place.

  • Settings: For the Slow Stochastic I use the K period of 14 and D period of 3. The Slow Stochastic tries to predict the market direction further out than just one day.
Relative Strength Index: The RSI signal is falling which is bearish.

  • Settings: The relative strength index is set for a period of 5 which gives it 5 days of market movement to monitor. It is often the first indicator to show an overbought or oversold signal.
Rate of Change: The rate of change is rising which is bullish.

Settings: Rate Of Change is set for a 21 period. This indicator looks back 21 days and compares price action from the past to the present. With the Rate Of Change, prices are rising when signals are positive. Conversely, prices are falling when signals are negative. As an advance rises, the Rate Of Change signal should also rise higher, otherwise the rally is suspect. A decline should see the Rate Of Change fall into negative signals. The more negative the signals the stronger the decline.


Stock Market Outlook: Support and Resistance Levels

7600 is resistance
7590 is resistance
7570 is resistance
7550 is resistance
7500 is resistance
7450 is resistance
7425 is resistance
7400 is resistance
7370 is support
7350 is support
7300 is support
7280 is support
7250 is support
7200 is support
7175 is support
7150 is support
7125 is support
7100 is good support


Stock Market Outlook for Fri Jul 24 2026 

On Thursday a number of stocks saw major declines including Alphabet Stock (GOOGL) down 7.1%, Tesla Stock (TSLA) down 14.5%, T-Mobile Stock (TMUS) down 10.7% and others. With oil prices climbing sharply, investors decided to take some profits and stocks tumbled. The technical indicators are overly bearish which often points to a possible bounce attempt. For Friday stocks could such a bounce but the outlook is still for a move lower.


Potential Economic and Political Market Moving Events

Monday:

10:00 Leading indicators for Jun came in lower than estimated at -0.2%

Tuesday:

no reports issues

Wednesday:

There are no reports

Thursday:

8:30 Weekly Initial Unemployment Insurance Claims were lower than estimated coming in at 187,000

Friday:

9:45 Flash Manufacturing PMI for July is estimated at 54.4, down from 55.7 prior

9:45 Flash services PMI for July is estimated at 51.5 up slightly from 51.3 prior

10:00 New Home Sales are estimated at 606,000 for Jun, up from 580,000 prior


Recent Outlooks

Stock Market Outlook For Fri Sep 18 2026 – Choppy – Dips Likely But Higher Close

Prior Trading Day Summary On Thu Sep 17 2026 stocks saw the bounce investors were waiting for. Everything lined up for the rally with oil prices dipping and bond yields also sliding lower after yesterday’s interest rate hike by the …

Morning Investing Strategy Notes for Thu Sep 17 2026

For FullyInformed Members the morning Investing Strategy Notes for Thu Sep 17 2026 review the aftermath of the Fed’s interest rate hike. Equities discussed today include SPY ETF, Delta Air Lines Stock (DAL), Lennar Corp Stock (LEN), Dell Technologies Stock …

Stock Market Outlook For Thu Sep 17 2026 – Bounce And Higher Close

Prior Trading Day Summary On Wed Sep 16 2026 stocks sold lower as the Fed Chair announced a quarter point rate hike. The hike was more symbolic as on its own it won’t do much to curb inflation and will …

Morning Investing Strategy Notes for Wed Sep 16 2026

For FullyInformed Members the morning Investing Strategy Notes for Wed Sep 16 2026 review the upcoming Fed’s latest interest rate announcement in what could be a volatile session for stocks. Equities discussed today include SPY ETF, Intel Stock (INTC), Delta …

Stock Market Outlook For Wed Sep 16 2026 – All About The Fed’s Interest Rate Announcement

Prior Trading Day Summary On Tue Sep 15 2026 stocks stayed weak as oil rose and bond yields continued to climb. Investor angst over what most analysts believe will be a hike in interest rates kept stocks depressed while worries …

Morning Investing Strategy Notes for Tue Sep 15 2026

For FullyInformed Members the morning Investing Strategy Notes for Tue Sep 15 2026 review the outlook for the day ahead of the Fed’s latest interest rate announcement. Equities discussed today include SPY ETF, Advanced Micro Devices Stock (AMD),  Crowdstrike Stock …

Stock Market Outlook For Tue Sep 15 2026 – Weakness Continuing But Bounce Likely

Prior Trading Day Summary On Mon Sep 14 2026 investor mulled over warnings about “slowing down” AI development along with 10 year bond yields reaching 5% as oil moved higher yet again. Yet despite all of this, selling was mild …

Morning Investing Strategy Notes for Mon Sep 14 2026

For FullyInformed Members the morning Investing Strategy Notes for Mon Sep 14 2026 review the outlook and whether Friday’s rally can continue today. Equities discussed today include SPY ETF, Oracle Stock (ORCL), Advanced Micro Devices Stock (AMD),  Apple Stock (AAPL) …

Stock Market Outlook For Mon Sep 14 2026 – Nice Bounce But Weakness With Dips Likely

Prior Trading Day Summary On Friday Sep 11 2026 stocks bounced. The SPX rose 65 points to close at 7657 on volume of 4.8 billion shares traded. For the week the SPX was down 65 points. The NASDAQ bounced 251 points …

Morning Investing Strategy Notes for Fri Sep 11 2026

For FullyInformed Members the morning Investing Strategy Notes for Fri Sep 11 2026 review the possibility of a bounce attempt. Equities discussed today include Oracle Stock (ORCL), Advanced Micro Devices Stock (AMD),  Apple Stock (AAPL) and more. The morning Investing …

Stock Market Outlook For Fri Sep 11 2026 – Chance Of A Bounce But Still Weak

Prior Trading Day Summary On Thu Sep 10 2026 stock indexes closed lower for a fourth day as investors remain focused on rising bond yields, climbing oil prices and concerns the Fed will raise interest rates next week. The SPX …

Morning Investing Strategy Notes for Thu Sep 10 2026

For FullyInformed Members the morning Investing Strategy Notes for Thu Sep 10 2026 review the outlook for another down day. Equities discussed today include Oracle Stock (ORCL), Qualcomm Stock (QCOM),  Apple Stock (AAPL) and more. The morning Investing Strategy Notes …

Stock Market Outlook For Thu Sep 10 2026 – Continuing Lower As Bond Yields and Oil Rise

Prior Trading Day Summary On Wed Sep 9 2026 stock indexes closed lower for a third day as bond yields rose, oil rose and investors fretted ahead of the upcoming inflation readings due out today and Friday. The SPX fell …

Morning Investing Strategy Notes for Wed Sep 9 2026

For FullyInformed Members the morning Investing Strategy Notes for Wed Sep 9 2026 review the outlook for a second day of weakness for stocks. Equities discussed today include Fortinet Stock (FTNT), Qualcomm Stock (QCOM), Amgen Stock (AMGN) and more. The …

Subscribe For The Latest News