
Prior Trading Day Summary
On Tue Jul 14 2026 bank earnings along with tech stocks help drive the indexes higher. A 25% plunge in International Business Machines Stock (IBM) shook investors which kept any rally in check.
The SPX closed up 28 points to 7543 . Trading volume was low at 4.9 billion with 57% of stocks on the index rising by the close. Tuesday’s gain was just shy of 50% of Monday’s loss of 60 points.
The NASDAQ rose 234 points to end the day at 26,107. Volume was still poor at 7.6 billion shares traded. The close saw 54% of stocks rising. Tuesday’s gain was slightly more than half of Monday’s loss.
With the next quarterly earnings season now underway investor are hopeful companies can pull off another record breaking quarter but are cautious after watching IBM have its worse day ever.
Let’s review the closing technical indicators from Tue Jul 14 2026 to see what they predict for Wed Jul 15 2026.
Stock Market Outlook: SPX Closing Chart For Tue Jul 14 2026
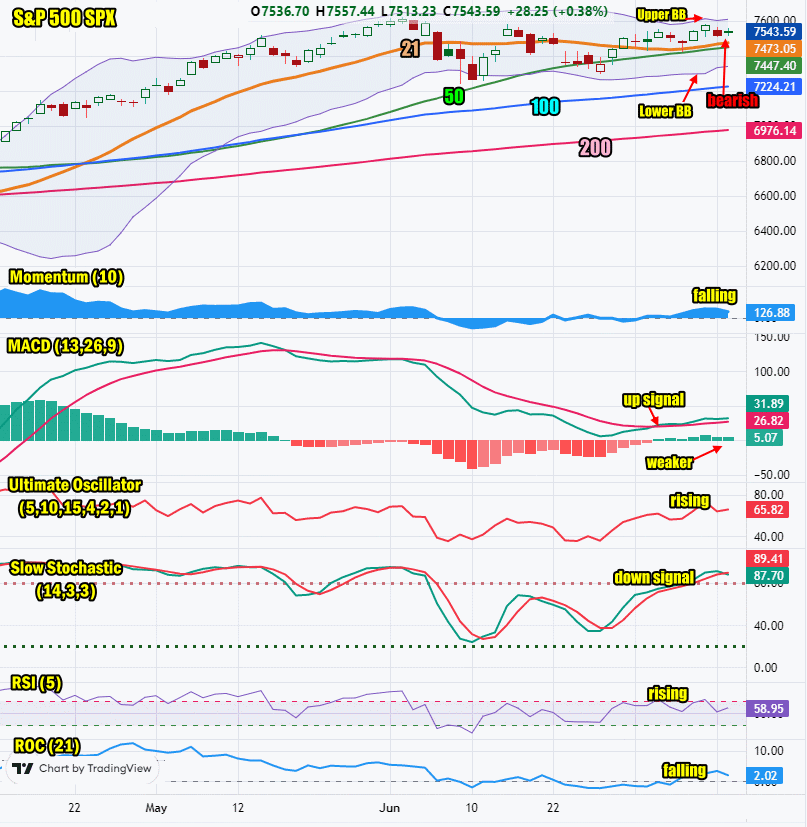
The index ended the day stll above the 21 day moving average.
The closing candlestick is bearish for Wednesday with two long shadows present which indicates a rocky day is probable for today.
The 21 day moving average is rising and closed at 7473. This is bullish.
The 50 day moving average is rising and closed at 7447. This is bullish.
The 100 day moving average is rising and closed at 7224. This is bullish.
The 200 day moving average is rising and closed at 6976. This is bullish.
The Lower Bollinger Band is rising. The Upper Bollinger Band is trending sideways. The Bollinger Bands Squeeze is ending with a good chance stocks will move higher.
The SPX chart is more bullish than bearish for Wed Jul 15 2026 but there are cautionary signals.
SPX Stock Market Outlook review of Tue Jul 14 2026
Stock Market Outlook: Technical Indicators Review
Momentum: Momentum is falling and positive. This is still bullish.
|
MACD Histogram: MACD (Moving Averages Convergence / Divergence) issued an up signal on Mon Jul 6 2026. The up signal was weaker on Tue Jul 14 2026.
|
Ultimate Oscillator: The Ultimate Oscillator is rising which is bullish.
|
Slow Stochastic: The Slow Stochastic started a new down signal on Tuesday. It is signaling stocks are overbought.
|
Relative Strength Index: The RSI signal is rising which is bullish.
|
| Rate of Change: The rate of change is falling signaling Wednesday will end lower. Settings: Rate Of Change is set for a 21 period. This indicator looks back 21 days and compares price action from the past to the present. With the Rate Of Change, prices are rising when signals are positive. Conversely, prices are falling when signals are negative. As an advance rises, the Rate Of Change signal should also rise higher, otherwise the rally is suspect. A decline should see the Rate Of Change fall into negative signals. The more negative the signals the stronger the decline. |
Stock Market Outlook: Support and Resistance Levels |
| 7600 is resistance |
| 7590 is resistance |
| 7570 is resistance |
| 7550 is resistance |
| 7500 is resistance |
| 7450 is resistance |
| 7425 is resistance |
| 7400 is resistance |
| 7370 is resistance |
| 7350 is support |
| 7300 is support |
| 7280 is support |
| 7250 is support |
| 7200 is support |
| 7175 is support |
| 7150 is support |
| 7125 is support |
| 7100 is good support |
| 7050 is good support |
| 7000 is stronger support |
Stock Market Outlook for Wed Jul 15 2026
For Wed Jul 15 2026 the technical signals are mixed. CPI readings on Tuesday were slightly less than estimated and that please many analysts who were expecting higher inflation numbers. At the same time the technical indicators are mixed with 3 signals falling, 2 signals rising and 1the MACD signal still positive but losing strength rapidly to the uptrend. This cautions investors that until more earnings are released, stay cautious and take on smaller positions than usual and keep cash at the ready just in case the index decides to pullback once again.
For Wednesday the outlook is mixed with a good chance for a slightly higher close and a decent chance the index ends lower. The recovery on Tuesday was basically 50% recovery of Monday’s losses. Often this is a typical bounce before more selling. For that reason stay cautious today..
Potential Economic and Political Market Moving Events
Monday:
No reports
Tuesday:
8:30 Consumer Price Index for June came in lower than estimated at -0.4%
8:30 CPI Year-over-year came in lower than estimated at 3.5%
8:30 Core CPI came in lower than estimated at 2.6%
10:00 Fed Chair Kevin Warsh is at the House Financial Services Committee
Wednesday:
8:30 PPI for June is estimated at 0%
8:30 Personal consumption for June is estimated at 1.1%
10:00 Fed Chair Kevin Warsh is testifying at Senate Banking Committee
2:00 Federal Beige Book is released