

FullyInformed.com
Generic filters
Exact matches only
Search in title
Search in content
Search in excerpt

Stock Market Outlook For Tue Jul 14 2026 – All About Bank Earnings

Jul 14, 2026 | Stock Market Outlook

Stock Market Outlook - All About Bank Earnings


Prior Trading Day Summary

On Mon Jul 13 2026 indexes spent the day in the red giving back some of last week’s gains.

The SPX closed down 60 points to 7515 . Trading volume was low at 4.8 billion with 54% of stocks on the index lower.

The NASDAQ tumbled 408 points to end the day at 25,873, back below 26,000. Volume was still poor at 7.4 billion shares traded. The close saw only 65 of stocks falling.

The day was all about tensions in the Middle East and rising oil prices. Today though will be about bank earnings.

Let’s review the closing technical indicators from Mon Jul 13 2026 to see what they predict for Tue Jul 14 2026.


Stock Market Outlook: SPX Closing Chart For Mon Jul 13 2026 

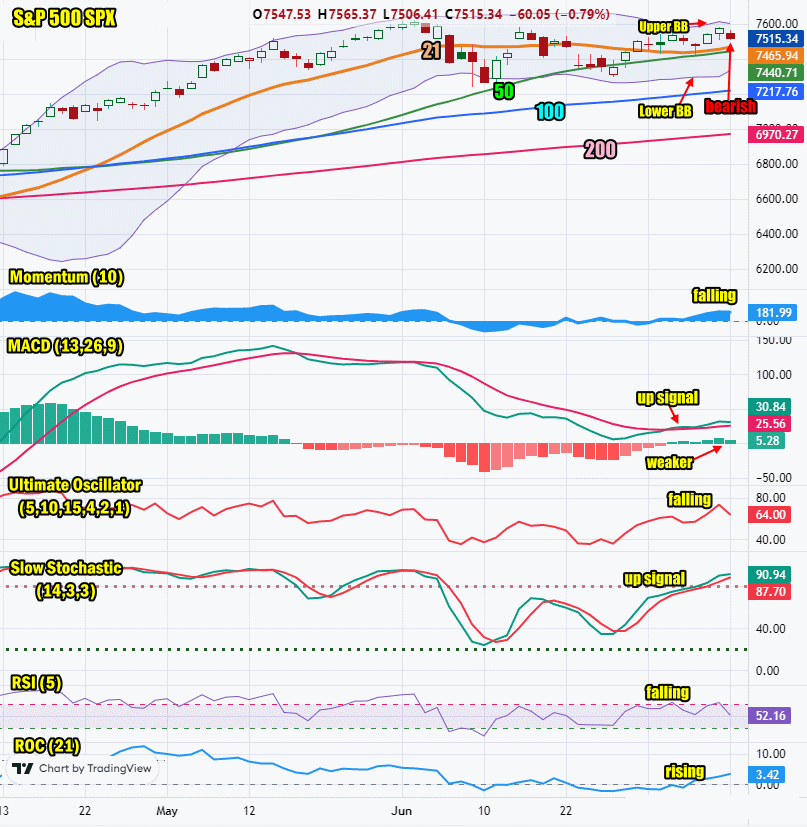
The index ended the day stll above the 21 day moving average after bouncing off 7500 late in the day. Looking at the SPX chart below you can see that the index is still trending sideways rather than up or down.

The closing candlestick is bearish for Tuesday but with a long shadow which indicates a dip or a bounce are possible.

The 21 day moving average is rising and closed at 7465. This is bullish.

The 50 day moving average is rising and closed at 7440. This is bullish.

The 100 day moving average is rising and closed at 7217. This is bullish.

The 200 day moving average is rising and closed at 6970. This is bullish.

The Lower Bollinger Band is rising. The Upper Bollinger Band is falling. The Bollinger Bands Squeeze is ending with a good chance stocks will move higher.

The SPX chart is more bullish than bearish for Tue Jul 14 2026 but there are couple of cautionary signals to be aware of.
SPX Stock Market Outlook review of Mon Jul 13 2026


Stock Market Outlook: Technical Indicators Review

Momentum: Momentum is falling and positive. This is bullish.

  • Settings: For momentum I use a 10 period when studying market direction.
MACD Histogram: MACD (Moving Averages Convergence / Divergence) issued an up signal on Mon Jul 6 2026. The up signal was weaker on Mon Jul 13 2026.

  • Settings: For MACD Histogram, I am using the Fast Points set at 13, Slow Points at 26 and Smoothing at 9.
Ultimate Oscillator: The Ultimate Oscillator is falling which is bearish.

  • Settings: The Ultimate Oscillator settings are: Period 1 is 5, Period 2 is 10, Period 3 is 15, Factor 1 is 4, Factor 2 is 2 and Factor 3 is 1. These are not the default settings but are the settings I use with the S&P 500 chart set for 1 to 3 months.
Slow Stochastic: The Slow Stochastic has an up signal in place. It is bullish. It is at overbought readings.

  • Settings: For the Slow Stochastic I use the K period of 14 and D period of 3. The Slow Stochastic tries to predict the market direction further out than just one day.
Relative Strength Index: The RSI signal is falling which is bearish.

  • Settings: The relative strength index is set for a period of 5 which gives it 5 days of market movement to monitor. It is often the first indicator to show an overbought or oversold signal.
Rate of Change: The rate of change is rising signaling Tuesday will end higher.

Settings: Rate Of Change is set for a 21 period. This indicator looks back 21 days and compares price action from the past to the present. With the Rate Of Change, prices are rising when signals are positive. Conversely, prices are falling when signals are negative. As an advance rises, the Rate Of Change signal should also rise higher, otherwise the rally is suspect. A decline should see the Rate Of Change fall into negative signals. The more negative the signals the stronger the decline.


Stock Market Outlook: Support and Resistance Levels

7600 is resistance
7590 is resistance
7570 is resistance
7550 is resistance
7500 is resistance
7450 is resistance
7425 is resistance
7400 is resistance
7370 is resistance
7350 is support
7300 is support
7280 is support
7250 is support
7200 is support
7175 is support
7150 is support
7125 is support
7100 is good support
7050 is good support
7000 is stronger support


Stock Market Outlook for Tue Jul 14 2026 

For Tue Jul 14 2026 the morning will be all about bank earnings which are released before today’s open. Any miss by the banks will see stocks move lower.

We also get the latest inflation readings from the Consumer Price Index today. This may impact stocks as well in the morning. Overall the technical indicators look strong enough for an up day today, even if bank earnings disappoint.


Potential Economic and Political Market Moving Events

Monday:

No reports

Tuesday:

8:30 Consumer Price Index for June is estimated to have fallen to -0.2% from 0.5% prior

8:30 CPI Year-over-year is estimated to have fallen to 3.8% from 4.2% prior

8:30 Core CPI is estimated as unchanged at 2.9%

10:00 Fed Chair Kevin Warsh is at the House Financial Services Committee


Recent Outlooks

Morning Investing Strategy Notes for Mon Jul 13 2026

For FullyInformed Members the morning Investing Strategy Notes for Mon Jul 13 2026 discuss the upcoming week for stocks. Equities discussed today include Bank Of America Stock (BAC), Wells Fargo Stock (WFC), Citigroup Stock (C), NVIDIA Stock (NVDA) and more …

Stock Market Outlook For Mon Jul 13 2026 – Dips Likely But Still Higher

Prior Trading Day Summary On Fri Jul 10 2026 stocks ended the day higher but once again on very low volume. The SPX closed up 31 points to 7575 . Trading volume was a low 4.1 billion with 57% of …

Morning Investing Strategy Notes for Fri Jul 10 2026

For FullyInformed Members the morning Investing Strategy Notes for Fri Jul 10 2026 discuss the outlook for the end of the week and the start of earnings next week. Equities discussed today include Bank Of America Stock (BAC), Wells Fargo …

Stock Market Outlook For Fri Jul 10 2026 – Morning Weakness Possible But Higher Close

Prior Trading Day Summary On Thu Jul 9 2026 stocks ended the day higher but on declining trade volumes. The SPX closed up 61 points to 7543 . Trading volume was a low 4.6 billion but 61% of stocks on …

Morning Investing Strategy Notes for Thu Jul 9 2026

For FullyInformed Members the morning Investing Strategy Notes for Thu Jul 9 2026 discuss the outlook following a lower close by the SPX on Wednesday. Equities discussed today include PepsiCo Stock (PEP), Levi Straus Stock (LEVI), Valero Energy Stock (VLO) …

Stock Market Outlook For Thu Jul 9 2026 – Weakness Returns

Prior Trading Day Summary On Wed Jul 8 2026 investors were once again focused on rising oil prices, inflation worries and the Iran conflict. The latest FOMC minutes were also a concern as they seemed to point to a strong …

Morning Investing Strategy Notes for Wed Jul 8 2026

For FullyInformed Members the morning Investing Strategy Notes for Wed Jul 8 2026 discuss the latest confirmed up signal versus the weakness we are seeing once again in many stocks. Equities discussed today include FedEx Stock (FDX), Citigroup Stock (C), …

Stock Market Outlook For Wed Jul 8 2026 – MACD Up Signal Confirmed

Prior Trading Day Summary On Tue Jul 7 2026 investors returned their focus to rising oil prices as tension rose in the Iran ceasefire. This combined with continuing worries about AI expense and chip stocks outlook, saw investors selling stocks …

Morning Investing Strategy Notes for Tue Jul 7 2026

For FullyInformed Members the morning Investing Strategy Notes for Tue Jul 7 2026 discuss the latest up signal and setting up some trades on Tuesday to try to take advantage of any move higher in stocks. Equities discussed today include …

Stock Market Outlook For Tue Jul 7 2026 – Still Bullish – Higher

Prior Trading Day Summary On Mon Jul 6 2026 stocks started the day with a bounce and built momentum on light volume of 5.1 billion. The SPX closed up 54 points to 7537. 51% of trading volume was rising along …

Morning Investing Strategy Notes for Mon Jul 6 2026

For FullyInformed Members the morning Investing Strategy Notes for Mon Jul 6 2026 discuss the outlook for the week following the long July 4th weekend. Equities discussed today include IWM ETF, Apple Stock (AAPL), FedEx Stock (FDX) and more. The …

Stock Market Outlook For Mon Jul 6 2026 – Choppy Dips Likely But Higher

Prior Trading Day Summary On Thu Jul 2 2026 the June Non-Farm Payroll Numbers came out much weaker than expected. Stocks initially shot higher but then spent most of the day giving back the early gains. By the close the …

Morning Investing Strategy Notes for Thu Jul 2 2026

For FullyInformed Members the morning Investing Strategy Notes for Thu Jul 2 2026 discusses the upcoming June Non-Farm Payroll Numbers due out today at 8:30. Equities discussed today include Apple Stock (AAPL), Nike Stock (NKE), Microsoft Stock (MSFT) and more …

Stock Market Outlook For Thu Jul 2 2026 – All About June Jobs Numbers

Prior Trading Day Summary On Wed Jul 1 2026 stocks experienced some weakness as many investors wait for the June Non-Farm Payroll Numbers due out today at 8:30. The SPX lost 16 points to close at 7483 on 5.9 billion …

Subscribe For The Latest News