

FullyInformed.com
Generic filters

Stock Market Outlook For Fri Oct 9 2026 – Weakness Continues

Oct 9, 2026 | Stock Market Outlook

Stock Market Outlook - Weakness


Prior Trading Day Summary

On Thu Oct 8 2026 stock indexes were lower as crude oil prices surged but also as Open AI annual earnings were reported by the Financial Times to be lower by $20 billion than estimates. This caused a sell-off in AI and semiconductor stocks. Losses were heavier on Thursday than on Wednesday but again there was no real panic.

The SPX ended the day down 36 points to close at 7765. Despite the down day, volume rose to 6.2 billion with 63% of all volume trading higher. New 52 week lows fell to 267 and new 52 week highs rose to just 35 but 61% of all stocks on the index were rising. For the week the SPX is still positive by 42 points.

The NASDAQ ended the day lower losing 345 points to 27, 193 on 9.1 billion shares traded. This was a jump of 1.6 billion shares as investors took advantage of many AI and semiconductor stocks declining to pick them up at a discount. New lows rose to 441 and 54% of all s stocks were falling but the volume pointed to investor confidence.

Let’s review the closing technical indicators from Thu Oct 8 2026 to see what they predict for Fri Oct 9 2026.


Stock Market Outlook: SPX Closing Chart For Thu Oct 8 2026 

The index ended the day below the Upper Bollinger Band but above the 21 day moving average for a fourth straight day. This is bullish.

The closing candlestick is bearish with shadow top and bottom indicating a choppy day is expected.

The 21 day moving average is rising and closed at 7692. This is bullish.

The 50 day moving average is rising and closed at 7689. This is bullish.

The 100 day moving average is rising and closed at 7537. This is bullish.

The 200 day moving average is rising and closed at 7277. This is bullish.

The Lower Bollinger Band is below the 50 day moving average but turning sideways which is neutral. The Upper Bollinger Band is rising which is also bullish.

The SPX chart is more bullish that bearish and is signaling the rally will see dips again today.
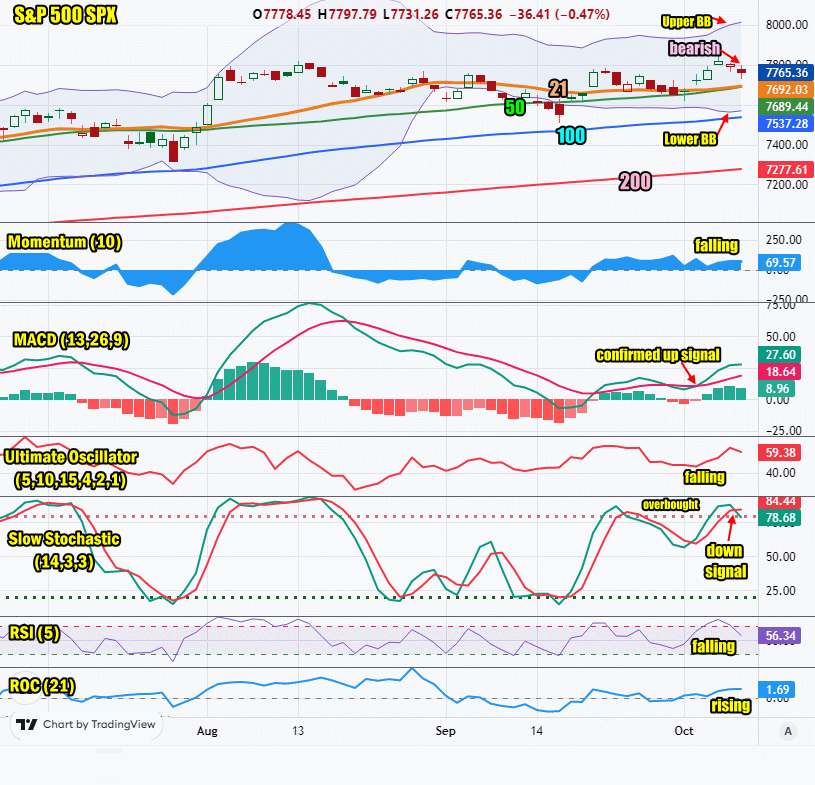
SPX Stock Market Outlook review of Thu Oct 8 2026


Stock Market Outlook: Technical Indicators Review

Momentum: Momentum is falling and positive. This is bullish.

  • Settings: For momentum I use a 10 period when studying market direction.
MACD Histogram: MACD (Moving Averages Convergence / Divergence) issued an up signal on MonOct 5 2026. The up signal was weaker on Thu Oct 8 2026.

  • Settings: For MACD Histogram, I am using the Fast Points set at 13, Slow Points at 26 and Smoothing at 9.
Ultimate Oscillator: The Ultimate Oscillator is falling. This is bearish.

  • Settings: The Ultimate Oscillator settings are: Period 1 is 5, Period 2 is 10, Period 3 is 15, Factor 1 is 4, Factor 2 is 2 and Factor 3 is 1. These are not the default settings but are the settings I use with the S&P 500 chart set for 1 to 3 months.
Slow Stochastic: The Slow Stochastic has a down signal in place and is overbought. This is bearish.

  • Settings: For the Slow Stochastic I use the K period of 14 and D period of 3. The Slow Stochastic tries to predict the market direction further out than just one day.
Relative Strength Index: The RSI signal is falling. This is bearish. It is overbought.

  • Settings: The relative strength index is set for a period of 5 which gives it 5 days of market movement to monitor. It is often the first indicator to show an overbought or oversold signal.
Rate of Change: The rate of change is rising, signaling that Friday will end higher.

Settings: Rate Of Change is set for a 21 period. This indicator looks back 21 days and compares price action from the past to the present. With the Rate Of Change, prices are rising when signals are positive. Conversely, prices are falling when signals are negative. As an advance rises, the Rate Of Change signal should also rise higher, otherwise the rally is suspect. A decline should see the Rate Of Change fall into negative signals. The more negative the signals the stronger the decline.


Stock Market Outlook: Support and Resistance Levels

7850 is resistance
7825 is resistance
7800 is resistance
7780 is resistance
7750 is resistance
7700 is resistance
7650 is resistance
7600 is support
7570 is support
7550 is support
7500 is support


Stock Market Outlook for Fri Oct 9 2026 

To start the day on Friday we get earnings from Delta Air Lines Stock (DAL) which are estimated to miss on revenue and earnings. This could help setup the index for a weak day with selling expected.

If Delta Air Lines Stock (DAL) moves higher however and beats estimates, we could see investor confidence stabilize and more buying of stocks that sold lower yesterday, take place.

Overall the earnings from OpenAI I believe are not of a present concern. The more important numbers will be from companies like NVIDIA (NVDA) who doesn’t report earnings until Nov 17.

Next week is all about bank earnings. For that reason I am expecting further weakness today but not heavy selling as investors prepare for the start of earnings next week.


Potential Economic and Political Market Moving Events

Monday:

10:00 ISM Report on business services PMI for Sep was higher than estimated coming in at 58.8

Tuesday:

8:30 Trade Balance for Aug was worse than estimated coming in at -105.6 billion

Wednesday:

2:00 FOMC latest minutes showed an interest rate is likely this fall

3:00 Consumer credit was better than estimated coming in at 8.3 billion

Thursday:

8:30 Weekly Initial Unemployment Insurance Claims for Oct 3 came in at 197,000

10:00 Monthly Wholesale Trade for Aug rose higher than estimated at 1.8%

Friday:

No reports on consequence expected


Recent Outlooks

Morning Investing Strategy Notes for Thu Oct 8 2026

For FullyInformed Members the morning Investing Strategy Notes for Thu Oct 8 2026 look at the weakness seen on Wed Oct 7 2026 in the markets.. Equities discussed today include the Delta Air Lines Stock (DAL), Chevron Stock (CVX), Amgen …

Stock Market Outlook For Thu Oct 8 2026 – Weakness With Dips Likely But Bias Is Still Up

Prior Trading Day Summary On Wed Oct 7 2026 rising treasury yields with the 10 year near 5.3%. Combine this with rising oil prices and stocks indexes at all-time highs and many investors decided to take some of their profits …

Morning Investing Strategy Notes for Wed Oct 7 2026

For FullyInformed Members the morning Investing Strategy Notes for Wed Oct 7 2026 look at the state of the 3 day rally as we head into the 4th day. Equities discussed today include the SPY ETF, Apple Stock (AAPL), Home …

Stock Market Outlook For Wed Oct 7 2026 – MACD Up Signal Confirmed But Dips Likely

Prior Trading Day Summary On Tue Oct 6 2026 stocks continued the rally for a third day and set a new intraday high in both the SPX and NASDAQ. The SPX ended the day up 45 points to close at …

Morning Investing Strategy Notes for Tue Oct 6 2026

For FullyInformed Members the morning Investing Strategy Notes for Tue Oct 6 2026 review the chance for the rally to continue into a third day. Equities discussed today include the SPY ETF, Meta Stock (META), Tesla Stock (TSLA) and more …

Stock Market Outlook For Tue Oct 6 2026 – Unconfirmed MACD Up Signal

Prior Trading Day Summary On Mon Oct 5 2026 stocks rallied despite rising bond yields. Oil prices remained under some pressure. Markets were mixed with some stocks like NVIDIA Stock (NVDA), Meta Stock (META), Microsoft Stock (MSFT), Tesla Stock (TSLA) …

Morning Investing Strategy Notes for Mon Oct 5 2026

For FullyInformed Members the morning Investing Strategy Notes for Mon Oct 5 2026 review the outlook for the start of the week. Equities discussed today include the SPY ETF, Nike Stock (NKE), NVIDIA Stock (NVDA) and more. The morning Investing …

Stock Market Outlook For Mon Oct 5 2026 – Choppy Dips Likely But Higher Close

Prior Trading Day Summary On Fri Oct 2 2026 stocks rallied strongly on the back on lower than estimated September jobs numbers. Only 29,000 jobs were created, far below estimated. Unemployment rose to 4.2%. As well, jobs were lowered by …

Morning Investing Strategy Notes for Fri Oct 2 2026

For FullyInformed Members the morning Investing Strategy Notes for Fri Oct 2 2026 review the outlook for the final trading day of the week. Equities discussed today include the SPY ETF, Boeing Stock (BA), Microsoft Stock (MSFT), Netflix Stock (NFLX) …

Stock Market Outlook For Fri Oct 2 2026 – All About The September Jobs Numbers

Prior Trading Day Summary On Thu Oct 1 2026 stocks sank intraday but then stages a comeback rally on good volume. All 3 indexes closed positive. The SPX ended the day up 15 points to close at 7666. Volume rose …

Morning Investing Strategy Notes for Thu Oct 1 2026

For FullyInformed Members the morning Investing Strategy Notes for Thu Oct 1 2026 reviews the outlook for the remainder of the week for stocks. Equities discussed today include Boeing Stock (BA), Micron Technology Stock (MU), Microsoft Stock (MSFT), Netflix Stock …

Stock Market Outlook For Thu Oct 1 2026 – Unconfirmed MACD Down Signal But Bounce Expected Thanks To Micron

Prior Trading Day Summary On Wed Sep 30 2026 stocks tried to a positive close to end the month o September but only the NASDAQ managed to end in the green. The S&P sold lower in the final half hour …

Morning Investing Strategy Notes for Wed Sep 30 2026

For FullyInformed Members the morning Investing Strategy Notes for Wed Sep 30 2026 views the potential market reaction to today’s latest PCE reports. Equities discussed today include Boeing Stock (BA), Micron Technology Stock (MU), Microsoft Stock (MSFT), Netflix Stock (NFLX) …

Stock Market Outlook For Wed Sep 30 2026 – Flat To Higher Close With Micron Earnings After Hours

Prior Trading Day Summary On Tue Sep 29 2026 stocks struggled for a second day with higher Treasury yields and ongoing concerns about oil prices. But the close saw most of the intraday losses recovered which is bullish. The SPX …

Subscribe For The Latest News