

Prior Trading Day Summary
On Tue Aug 25 2026 investors stayed within a tight range but failed to break below 7650 which remains interim support with better support at 7500.
The SPX ended the day up 24 points at 7677 on declining volume of 4.3 billion, By the close 49% of stocks were climbing.
The NASDAQ rose 171 points to 26151 as investors sifted through beaten down tech stocks. Volume was 7.7 billion with 62% of stocks on the index rising by the close.
The stunner on Tuesday was Dick’s Sporting Goods Stock (DKS) which had its worst day since listing, plunging 30.6% for a huge $55& drop and closing at 124.31 and reporting earnings that missed estimates and were 19% below the same quarter last year. Revenue though jumped to $5.6 billion. Forward guidance discussed declining athletic purchasing by consumers. All of this crushed the stock. The Trade setup on Monday using the Trade Ahead Of Earnings Strategy was closed on Tuesday for a large profit. Members have access to those details.
Wednesday we get more inflation data in the morning and NVIDIA (NVDA) earnings after the close. It could be a calm day or a wild one. Much will depend on the inflation data. The 30 year bond closed at 5.174% down just slightly from the prior day but still above 5%. This is a headwind for stocks but it is certainly helping gold and Bitcoin.
Let’s review the SPX closing technical indicators from Tue Aug 25 2026 to see what they predict for Wed Aug 26 2026.
Stock Market Outlook: SPX Closing Chart For Tue Aug 25 2026
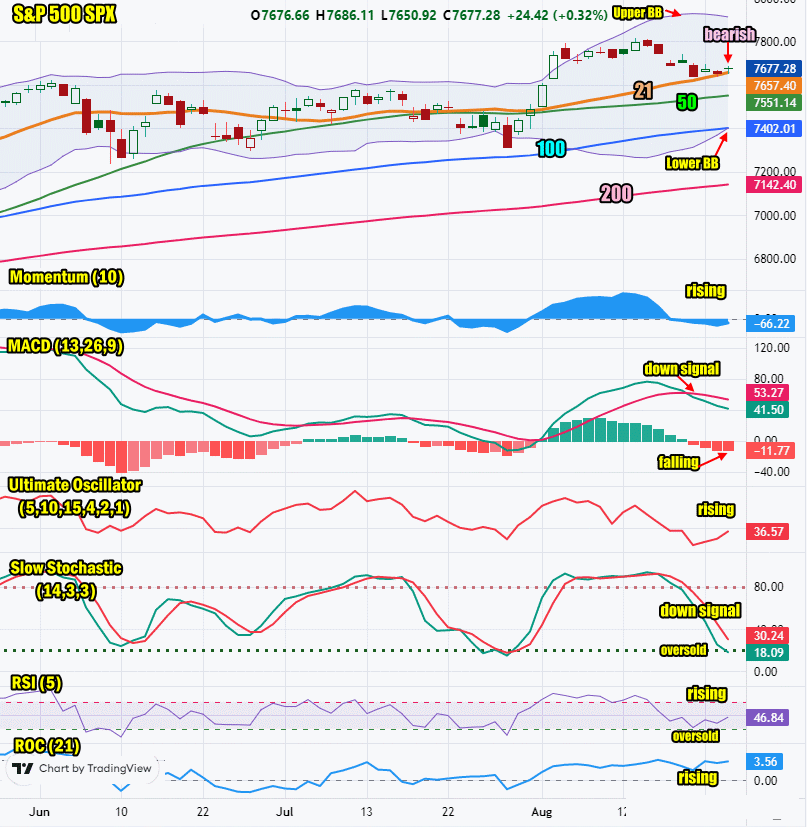
The index ended the day below the Upper Bollinger Band and at the 21 day moving average. This is bearish.
The closing candlestick is bearish for Wednesday but another bounce could be attempted off the 21 day moving average. Technically the twin candlestick shadows as seen on Tuesday’s closing candlestick are often followed by an up day.
The 21 day moving average is rising and closed at 7657. This is bullish.
The 50 day moving average is rising and closed at 7551. This is bullish.
The 100 day moving average is rising and closed at 7402. This is bullish.
The 200 day moving average is rising and closed at 7142. This is bullish.
The Lower Bollinger Band is rising and is at the 100 day moving average which is bearish. The Upper Bollinger Band is falling which is bearish. Signals are advising stocks may pullback further.
The SPX chart is more bearish than bullish for Wednesday although the closing candlestick offers some hope of a bounce attempt.
SPX Stock Market Outlook review of Tue Aug 25 2026
Stock Market Outlook: Technical Indicators Review
Momentum: Momentum is rising and negative. This is bearish.
|
MACD Histogram: MACD (Moving Averages Convergence / Divergence) issued an down signal on Thu Aug 20 2026. On Tue Aug 25 2026 the down signal didn’t gain strength but did not lose any either..
|
Ultimate Oscillator: The Ultimate Oscillator is rising.
|
Slow Stochastic: The Slow Stochastic has a down signal in place. It is bearish and heading into oversold readings. The indicator is signaling a possible bounce attempt.
|
Relative Strength Index: The RSI signal is rising which is bullish.
|
| Rate of Change: The rate of change is rising and signaling that Wednesday will end higher. Settings: Rate Of Change is set for a 21 period. This indicator looks back 21 days and compares price action from the past to the present. With the Rate Of Change, prices are rising when signals are positive. Conversely, prices are falling when signals are negative. As an advance rises, the Rate Of Change signal should also rise higher, otherwise the rally is suspect. A decline should see the Rate Of Change fall into negative signals. The more negative the signals the stronger the decline. |
Stock Market Outlook: Support and Resistance Levels |
| 7800 is resistance |
| 7780 is resistance |
| 7750 is resistance |
| 7700 is resistance |
| 7650 is resistance |
| 7600 is resistance |
| 7590 is resistance |
| 7570 is resistance |
| 7550 is resistance |
| 7500 is support |
| 7450 is support |
| 7425 is support |
| 7400 is support |
Stock Market Outlook for Wed Aug 26 2026
For Wednesday the SPX is slightly above the important 7650 support level. This is light support but the SPX is continuing to hold it and that assists the bulls.
None of the technical indicators have turned “more bearish” and a couple are trying to turn back up. Today’s market action will be determined at the open with the latest read on inflation at 8:30 with the PCE reports being released for July. Following that, investors may trade the market sideways with a slight pop at the close as they wait for earnings from NVIDIA. Those earnings are released after the close today. On Friday Fed Chair Warsh speaks from Jackson Hole. Many economists have spoken out that they hope the Fed Chair will be clearer and more direct with his comments. If not we could see a weak close on Friday. Today though stocks could attempt another bounce and try to close higher before NVIDIA Stock (NVDA) earnings.
Potential Economic and Political Market Moving Events
Monday:
No reports
Tuesday:
10:00 New Home Sales for July were lower than estimated coming in at 607,000
10:00 Conference Board Consumer Confidence for August fell more than estimated to 89.4
Wednesday:
8:30 Durable goods for July are estimated at 0.5% up from 0.3% prior
8:30 2nd estimated GDP for second quarter is estimated unchanged at 1.5%
8:30 Personal income is estimated for July to rise to 0.3% from 0.2% prior
8:30 Consumer spending is estimated to rise to 0.7% from -0.1% prior
8:30 Personal Consumption Expenditures price index for July is estimated to rise to 0.1% from -0.1%
8:30 PCE price index year-over-year is estimated to fall for July to 3.6% from 3.7% prior
8:30 PCE Core price index (month to month) for July is estimated to rise to 0.2% from 0.1% prior
8:30 PCE Core Prince index year-over-year for July is estimated to rise to 3.4% from 3.3% prior