

Prior Trading Day Summary
On Fri Aug 21 2026 stocks moved higher fueled in part by better than estimated earnings from Ross Stores Stock (ROST) which ended the day up 4.39% to $23.04 but intraday reached $243.86. Other factrs included many stocks being oversold and a technical bounce was expected. As well flash services PMI rose to 56.8 better than any estimates and higher than 53.6 prior. Flash manufacturing slipped slightly to 53.2 from 53.8 prior. The last spark for Friday’s rally came from crypto and mining stocks which rose as the dollar drifted lower.
The SPX ended the day up 33 points to close at 7674. Volume was still lower at 4.6 billion with 59% of all stocks rising on the index by the close. For the week the index was down 111 points or just 1.4%.
The NASDAQrose 113 points ending the day at 26,180. Volume was lower by 900 million shares to 7.6 billion. By the close 62% of all stocks were rising. For the week the NASDAQ lost 548 points or 2%.
Let’s review the technical indicators from the close of Fri Aug 21 2026 to see what they predict for Mon Aug 24 2026.
Stock Market Outlook: SPX Closing Chart For Fri Aug 21 2026
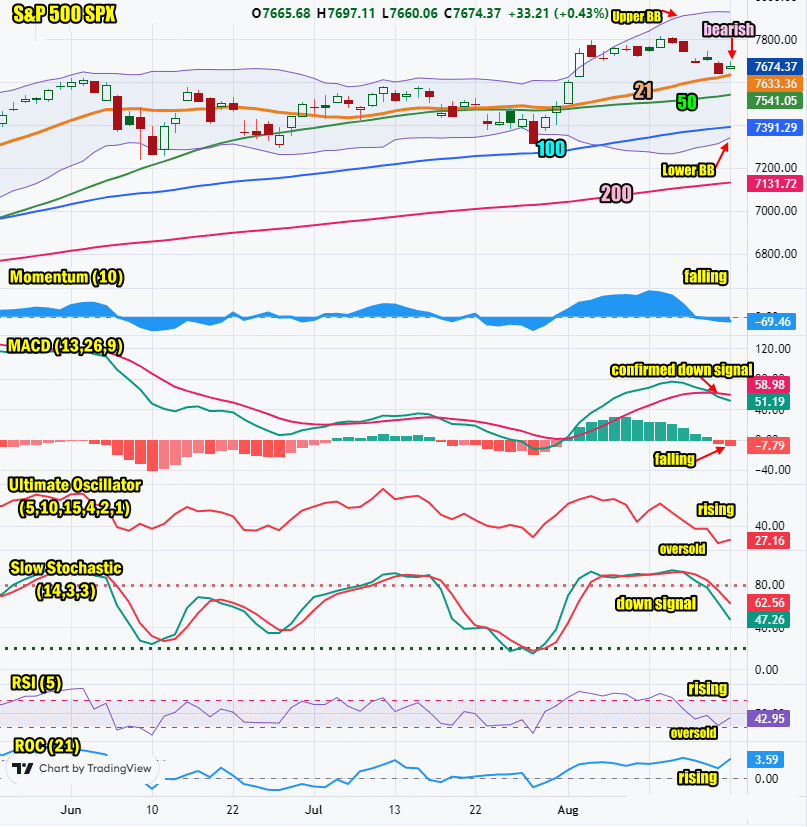
The index ended the day below the Upper Bollinger Band and just above the 21 day moving average. This is bearish.
The closing candlestick is bearish for Monday but with a long shadow which signals a good chance we will see a bounce on Monday.
The 21 day moving average is rising and closed at 7633. This is bullish.
The 50 day moving average is rising and closed at 7541. This is bullish.
The 100 day moving average is rising and closed at 7391. This is bullish.
The 200 day moving average is rising and closed at 7131. This is bullish.
The Lower Bollinger Band is rising which is bearish. The Upper Bollinger Band is trending sideways which is bearish. Signals are advising stocks may pullback further.
The SPX chart is more bearish than bullish for Monday but also signals a second bounce off the 21 day is likely.
SPX Stock Market Outlook review of Sat Aug 22 2026
Stock Market Outlook: Technical Indicators Review
Momentum: Momentum is falling and negative. This is bearish.
|
MACD Histogram: MACD (Moving Averages Convergence / Divergence) issued an down signal on Thu Aug 20 2026. On Fri Aug 21 the down signal was confirmed.
|
Ultimate Oscillator: The Ultimate Oscillator is rising as it is near oversold levels. At present this is not bullish or bearish.
|
Slow Stochastic: The Slow Stochastic has a down signal in place. It is bearish.
|
Relative Strength Index: The RSI signal is rising from oversold levels. A bounce is likely again on Monday.
|
| Rate of Change: The rate of change is rising. It is signaling Monday will end higher. Settings: Rate Of Change is set for a 21 period. This indicator looks back 21 days and compares price action from the past to the present. With the Rate Of Change, prices are rising when signals are positive. Conversely, prices are falling when signals are negative. As an advance rises, the Rate Of Change signal should also rise higher, otherwise the rally is suspect. A decline should see the Rate Of Change fall into negative signals. The more negative the signals the stronger the decline. |
Stock Market Outlook: Support and Resistance Levels |
| 7800 is resistance |
| 7780 is resistance |
| 7750 is resistance |
| 7700 is resistance |
| 7650 is resistance |
| 7600 is resistance |
| 7590 is resistance |
| 7570 is resistance |
| 7550 is resistance |
| 7500 is support |
| 7450 is support |
| 7425 is support |
| 7400 is support |
Stock Market Outlook for Mon Aug 24 2026
For Mon Aug 24 2026 the technical indicators are advising there is a good chance for a second bounce but a test of the 21 day moving average is still likely. Some stocks showed a bit of strength on Friday, in particular the mining sector. We could see further gains today in that sector.
The MACD technical down signal is confirmed and it has been one of the more reliable signals. Despite the down signal though, we could still see investors try to hold the 21 day moving average. Unless the index can close higher on Monday, there is a good chance we could see the 50 day moving average challenged this week before a more meaningful rally is attempted. Trading volumes are declining as the month brings the end of summer holidays. Often that results in sideways days and choppy trading. September follows which has a history of higher volatility. With the war with Iran still unresolved and high oil prices, September could be a toucher month for stocks, especially if bond yields were to continue to rise.
For Monday then, expect another bounce attempt and may be even a higher close but the outlook is still lower at present.
Potential Economic and Political Market Moving Events
Monday:
No reports