
 Prior Trading Day Summary:
On Tuesday the morning saw stocks plunge but not as deep as on Thursday. That brought in the dip buyers who picked through the stocks and by the close they had turned the index to a positive close.
The S&P closed up 7 points to 5209 and the NASDAQ rose 19 points to 16306. It was a wild day on both indexes but with plenty of opportunities for profits.
Let’s review the closing technical indicators on Tue Apr 9 2024 to see what to expect for Wed Apr 10 2024.
Stock Market Outlook: SPX Closing Chart For Tue Apr 9 2024
The index closed well below the Upper Bollinger Band and at the 21 day moving average. This is bearish to neutral for a second day.
The closing candlestick is neutral for Wednesday.
The 21 day moving average is now turning sideways which is bearish.
The 50 day moving average is rising and at 5095, which is bullish.
The 100 and 200 day moving averages are climbing which is bullish. The 200 day is at 4704 on the SPX which is bullish.
The Bollinger Bands are in another Bollinger Bands Squeeze. The Lower Bollinger Band is turning back up while the Upper Bollinger Band is turning lower. A new Bollinger Bands Squeeze is underway and at present the squeeze looks like it will end with stocks moving lower.
The S&P chart is more bullish than bearish for Wednesday.
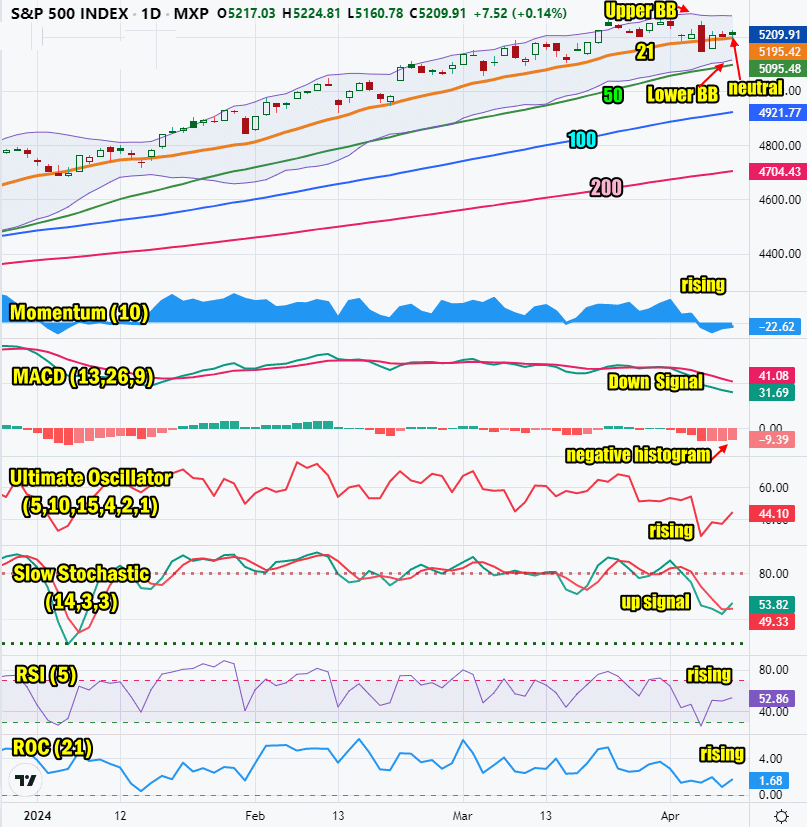
SPX Stock Market Outlook review of Tue Apr 9 2024 – chart courtesy TradingView
Stock Market Outlook: Technical Indicators Review
Momentum: Momentum is rising and negative.
|
MACD Histogram: MACD (Moving Averages Convergence / Divergence) issued a down signal on Tue Apr 2. On Tue Apr 9 2024 the down signal was still strong. The MACD histogram is also strongly negative.
|
Ultimate Oscillator: The Ultimate Oscillator is rising.
|
Slow Stochastic: The Slow Stochastic has an up signal in place
|
Relative Strength Index: The RSI signal is rising and positive.
|
Rate of Change: The rate of change signal is rising indicating Wednesday will end higher.
|
Stock Market Outlook: Support and Resistance Levels |
| 5275 is resistance |
| 5250 is resistance |
| 5225 is resistance |
| 5200 is resistance |
| 5190 is resistance |
| 5175 is resistance |
| 5150 is resistance |
| 5125 is support |
| 5115 is support |
| 5100 is support |
| 5075 is support |
| 5050 is support |
| 5025 is support |
| 5000 is light support |
| 4990 is light support |
| 4975 is light support |
| 4950 is support |
Stock Market Outlook for Wed Apr 10 2024
The morning direction for stocks will be dictated by the CPI numbers. Then in the afternoon at 2:00 PM, investors get the latest FOMC meeting notes. These are not expected to contain any surprises. If there is a surprise the market will behave badly.
At present the outlook is for the CPI numbers to be at the estimates and for stocks to continue to climb.
Potential Economic and Political Market Moving Events
The major events this week are on Tuesday with the latest PMI numbers being released and the Fed’s Beige Book due out Wednesday at 2:00 PM.
Monday:
No economic reports
Tuesday:
6:00 NFIB optimism index is expected to rise slightly to 89.7 Instead it rose to 88.5%.
Wednesday:
8:30 Consumer price index is expected to be lower at 0.3% versus 0.4% prior.
8:30 Core CPI is estimated to be 0.3%, lower than previous 0.4%
8:30 CPI year-over-year is expected to be 3.4%, up from the last reading of 3.2%
8:30 Core CPI year-over-year is estimated to be 3.7%
10:00 Wholesale inventories is expected to be 0.5%
2:00 Minutes of the March FOMC meeting
2:00 Monthly Federal USA budget is estimated at -$220 billion versus the prior -373 billion.