

FullyInformed.com
Generic filters

Stock Market Outlook For Tue Sep 1 2026 – Weakness Continuing

Sep 1, 2026 | Stock Market Outlook

Stock Market Outlook - Weakness


Prior Trading Day Summary

On Monday Aug 31 2026 markets moved lower from the open and were unable to rally. The close was weaker despite a rise in trading volumes.

The SPX fell 25 points to close at 7686 on volume of 5.5 billion a rise of 1.1 billion shares traded. By the close 63% of stocks were falling. For August though the SPX had another winning month as it rose 197 points for a 2.6% gain.

The NASDAQ lost just 31 points to end the day at 26370. Volume was 8.0 billion with 57% of all stocks declining by the close. For August the NASDAQ gained 997 points for a 3.9% rise in the month.

Let’s review the SPX closing technical indicators from Mon Aug 31 2026 to see what they predict for the first trading day of September.


Stock Market Outlook: SPX Closing Chart For Mon Aug 31 2026 

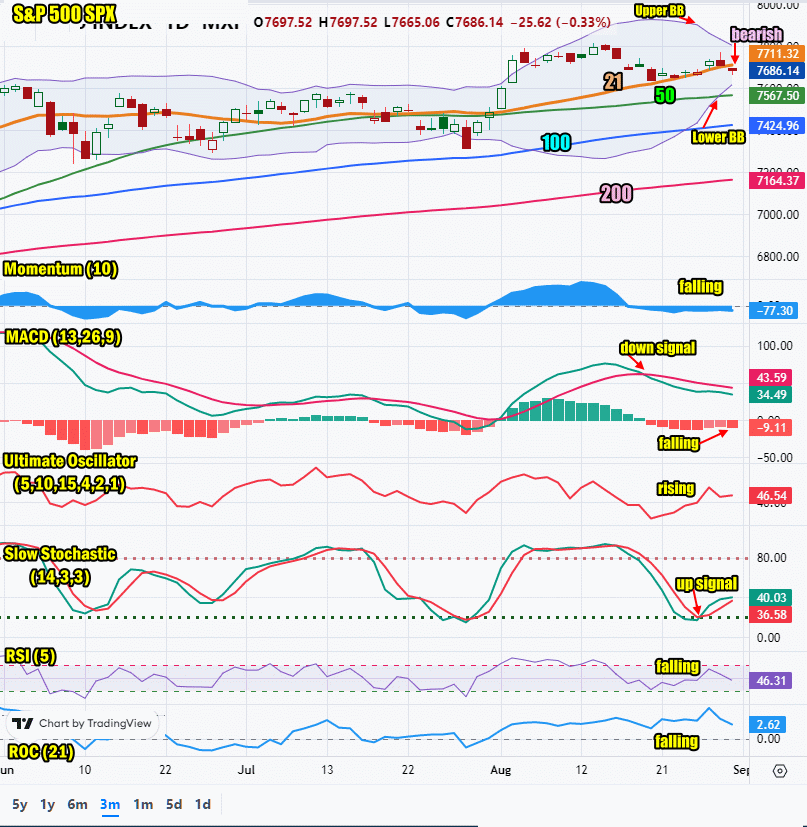
The index ended the day below the Upper Bollinger Band and below the 21 day moving average. This is bearish. The last time the SPX was below the 21 days was July 30.

The closing candlestick is bearish for Tuesday but still suggests a bounce could happen.

The 21 day moving average is rising and closed at 7711. This is bullish.

The 50 day moving average is rising and closed at 7567. This is bullish.

The 100 day moving average is rising and closed at 7424. This is bullish.

The 200 day moving average is rising and closed at 7164. This is bullish.

The Lower Bollinger Band is above the 100 day moving average and the 50 day moving average which is bearish. The Upper Bollinger Band is falling which is bearish. Signals are advising stocks are entering a sharp Bollinger Bands Squeeze with a good chance stocks will fall.

The SPX chart is more bearish than bullish for the first trading day of September.
SPX Stock Market Outlook review of Mon Aug 31 2026


Stock Market Outlook: Technical Indicators Review

Momentum: Momentum is falling and negative. This is bearish.

  • Settings: For momentum I use a 10 period when studying market direction.
MACD Histogram: MACD (Moving Averages Convergence / Divergence) issued an down signal on Thu Aug 20 2026. On Mon Aug 31 2026 the down signal gained strength.

  • Settings: For MACD Histogram, I am using the Fast Points set at 13, Slow Points at 26 and Smoothing at 9.
Ultimate Oscillator: The Ultimate Oscillator is rising and bullish.

  • Settings: The Ultimate Oscillator settings are: Period 1 is 5, Period 2 is 10, Period 3 is 15, Factor 1 is 4, Factor 2 is 2 and Factor 3 is 1. These are not the default settings but are the settings I use with the S&P 500 chart set for 1 to 3 months.
Slow Stochastic: The Slow Stochastic has an up signal in place which is bullish.

  • Settings: For the Slow Stochastic I use the K period of 14 and D period of 3. The Slow Stochastic tries to predict the market direction further out than just one day.
Relative Strength Index: The RSI signal is falling which is bearish.

  • Settings: The relative strength index is set for a period of 5 which gives it 5 days of market movement to monitor. It is often the first indicator to show an overbought or oversold signal.
Rate of Change: The rate of change is falling and signaling that Tuesday will end lower.

Settings: Rate Of Change is set for a 21 period. This indicator looks back 21 days and compares price action from the past to the present. With the Rate Of Change, prices are rising when signals are positive. Conversely, prices are falling when signals are negative. As an advance rises, the Rate Of Change signal should also rise higher, otherwise the rally is suspect. A decline should see the Rate Of Change fall into negative signals. The more negative the signals the stronger the decline.


Stock Market Outlook: Support and Resistance Levels

7800 is resistance
7780 is resistance
7750 is resistance
7700 is resistance
7650 is resistance
7600 is resistance
7590 is resistance
7570 is resistance
7550 is resistance
7500 is support
7450 is support
7425 is support
7400 is support


Stock Market Outlook for Tue Sep 1 2026 

TSeptember has a history of choppy trading, turmoil and surprises to the downside. For the start of September, it is disappointing to see a sharp Bollinger Bands Squeeze. At present signals are advising that stocks will move lower out of this latest squeeze.

For Tuesday I expect a choppy day of trading and a lower close.


Potential Economic and Political Market Moving Events

Monday:

No reports

Tuesday:

9:45 Manufacturing PMI for Aug is estimated to slip to 53.5 from 53.9 prior

10:00 ISM Report on Business Manufacturing PMI is estimated to fall to 55.3 from 55.6 prior

10: Construction spending for July is expected to come in at 0%

10:00 Job openings and Labor turnover for July is expected to slip to 7.3 million from 7.4 million prior

Wednesday:

8:15 ADP National Employment Report for August is estimated to rise to 47,000 from 44,000 prior

10:00 Factory orders for July are estimated to rise to 0.7% from -0.3% prior

2:00 Fed Beige Book


Recent Outlooks

Morning Investing Strategy Notes for Mon Aug 31 2026

For FullyInformed Members the morning Investing Strategy Notes for Mon Aug 31 2026 review the outlook for the final trading day of August. Equities discussed today include Microsoft Stock (MSFT), Apple Stock (AAPL) and more. The morning Investing Strategy Notes …

Stock Market Outlook For Mon Aug 31 2026 – Weakness To End August

Prior Trading Day Summary On Friday Aug 28 2026 markets tried to rally but in the end finished the day slightly negative thanks in large part to Fed Chair Warsh’s speech outlining the Fed concern with inflation. This brought back …

Morning Investing Strategy Notes for Fri Aug 28 2026

For FullyInformed Members the morning Investing Strategy Notes for Fri Aug 28 2026 review Thursday’s rally and the chance for it to continue Friday. Equities discussed today include Marvell Stock (MRVL), Autodesk Stock (ADSK), Workday Stock (WDAY), IWM ETF, Apple …

Stock Market Outlook For Fri Aug 28 2026 – All About The Fed

Prior Trading Day Summary On Thu Aug 27 2026 earnings bounce NVIDIA Stock (NVDA), Crowdstrike Stock (CRWD), Salesforce.com Stock (CRM) and Okta Stock (OKTA) which also meant related stocks also rose like Intel Stock (INTC), Palo Alto Networks Stock (PANW), …

Morning Investing Strategy Notes for Thu Aug 27 2026

For FullyInformed Members the morning Investing Strategy Notes for Thu Aug 27 2026 discuss the outlook for stocks following the earnings beat from NVIDIA (NVDA). Equities discussed today include NVIDIA Stock (NVDA), Salesforce.com Stock (CRM), Crowdstrike Stock (CRWD), Marvell Stock …

Stock Market Outlook For Thu Aug 27 2026 – Higher Thanks To NVIDIA Earnings

Prior Trading Day Summary On Wednesday investors were in a holding pattern ahead of NVIDIA (NVDA) earnings which were released after the close. NVIDIA Stock (NVDA) blew away all estimates and while the stock dipped initially, it began to climb …

Morning Investing Strategy Notes for Wed Aug 26 2026

For FullyInformed Members the morning Investing Strategy Notes for Wed Aug 26 2026 discuss the outlook for the remainder of the week. Equities discussed today include SMH ETF, Amgen Stock (AMGN), Dick’s Sporting Goods Stock (DKS), NVIDIA Stock (NVDA), Salesforce.com …

Stock Market Outlook For Wed Aug 26 2026 – Inflation and NVIDIA (NVDA) – Still Bearish But Bounce Possible

Prior Trading Day Summary On Tue Aug 25 2026 investors stayed within a tight range but failed to break below 7650 which remains interim support with better support at 7500. The SPX ended the day up 24 points at 7677 …

Morning Investing Strategy Notes for Tue Aug 25 2026

For FullyInformed Members the morning Investing Strategy Notes for Tue Aug 25 2026 discuss the outlook for a potential second bounce attempt on Tuesday. Equities discussed today include Amgen Stock (AMGN), Intuit Stock (INTU), Abercrombie & Fitch Stock (ANF) and …

Stock Market Outlook For Tue Aug 25 2026 – Bounce Likely Off 21 Day But Bearish

Prior Trading Day Summary On Mon Aug 24 2026 stocks spent the day trading in a fairly tight range with the low at 7638 and high at 7670. Support at present is at 7650 and the index ended Monday at …

Morning Investing Strategy Notes for Mon Aug 24 2026

For FullyInformed Members the morning Investing Strategy Notes for Mon Aug 24 2026 discuss the outlook for the start of the week and recap Friday’s higher close. Equities discussed today include Apple Stock (AAPL), Microsoft Stock (MSFT), XRT ETF, Newmont …

Stock Market Outlook For Mon Aug 24 2026 – Confirmed MACD Down Signal But Bounce Expected

Prior Trading Day Summary On Fri Aug 21 2026 stocks moved higher fueled in part by better than estimated earnings from Ross Stores Stock (ROST) which ended the day up 4.39% to $23.04 but intraday reached $243.86. Other factrs included …

Morning Investing Strategy Notes for Fri Aug 21 2026

For FullyInformed Members the morning Investing Strategy Notes for Fri Aug 21 2026 discuss the outlook for stocks following Thursday’s new MACD unconfirmed down signal. There are a number of equity trades today. Stocks include Apple Stock (AAPL), Moderna Stock …

Stock Market Outlook For Fri Aug 21 2026 – Unconfirmed MACD Down Signal

Prior Trading Day Summary On Thu Aug 20 2026 stocks moved lower as bond yields rose again despite the efforts of Treasury Secretary Bessent to calm bond markets.  days is anyone’s guess. The SPX ended the day down 66 points …

Subscribe For The Latest News