

Prior Trading Day Summary
On Thu Aug 27 2026 earnings bounce NVIDIA Stock (NVDA), Crowdstrike Stock (CRWD), Salesforce.com Stock (CRM) and Okta Stock (OKTA) which also meant related stocks also rose like Intel Stock (INTC), Palo Alto Networks Stock (PANW), Fortinet Stock (FTNT) and more. The day ended higher but volume was poor and many other stocks were moving sideways while waiting for the Fed Chair’s comments from Jackson Hole due out on Friday. With worries about interest rates and inflation dominating the rally on Thursday was a nice break. The rally also silenced many analysts who have been predicting significant declines in many tech names like NVIDIA. The negative sentiment is bound to return but perhaps not on Friday.
The SPX rose 55 points to close at 7731 on volume of 4.5 billion, By the close only 43% of stocks were climbing.
The NASDAQ rose 411 points to 26541. Volume was 7.7 billion with 51% of stocks on the index rising by the close.
Let’s review the SPX closing technical indicators from Thu Aug 27 2026 to see what they predict for Fri Aug 28 2026.
Stock Market Outlook: SPX Closing Chart For Thu Aug 27 2026
The index ended the day below the Upper Bollinger Band and just above the 21 day moving average. This is bearish.
The closing candlestick is bullish for Friday although there are a couple of shadows which suggest some dips are likely.
The 21 day moving average is rising and closed at 7688. This is bullish.
The 50 day moving average is rising and closed at 7557. This is bullish.
The 100 day moving average is rising and closed at 7413. This is bullish.
The 200 day moving average is rising and closed at 7153. This is bullish.
The Lower Bollinger Band is above the 100 day moving average and now rising to the 50 day moving average which is bearish. The Upper Bollinger Band is falling which is bearish. Signals are advising stocks may pullback further.
The SPX chart is more bearish than bullish for Friday.
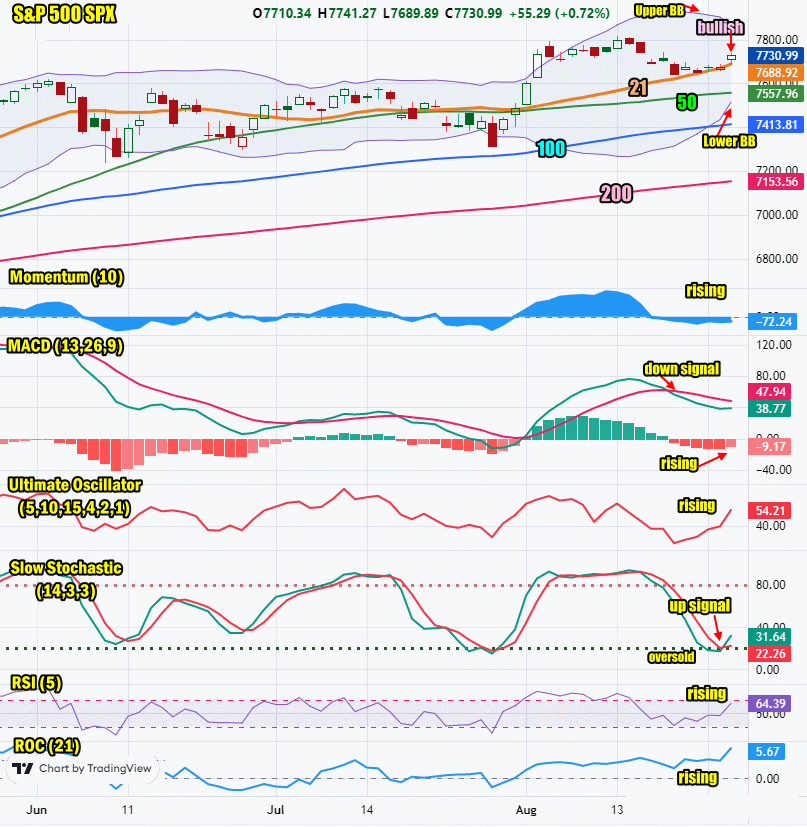
SPX Stock Market Outlook review of Thu Aug 27 2026
Stock Market Outlook: Technical Indicators Review
Momentum: Momentum is rising and negative. This is bearish.
|
MACD Histogram: MACD (Moving Averages Convergence / Divergence) issued an down signal on Thu Aug 20 2026. On Thu Aug 27 2026 the down signal lost some strength.
|
Ultimate Oscillator: The Ultimate Oscillator is rising which is bullish.
|
Slow Stochastic: The Slow Stochastic has an up signal in place which is bullish.
|
Relative Strength Index: The RSI signal is rising which is bullish.
|
| Rate of Change: The rate of change is rising and signaling that Friday will end higher. Settings: Rate Of Change is set for a 21 period. This indicator looks back 21 days and compares price action from the past to the present. With the Rate Of Change, prices are rising when signals are positive. Conversely, prices are falling when signals are negative. As an advance rises, the Rate Of Change signal should also rise higher, otherwise the rally is suspect. A decline should see the Rate Of Change fall into negative signals. The more negative the signals the stronger the decline. |
Stock Market Outlook: Support and Resistance Levels |
| 7800 is resistance |
| 7780 is resistance |
| 7750 is resistance |
| 7700 is resistance |
| 7650 is resistance |
| 7600 is resistance |
| 7590 is resistance |
| 7570 is resistance |
| 7550 is resistance |
| 7500 is support |
| 7450 is support |
| 7425 is support |
| 7400 is support |
Stock Market Outlook for Fri Aug 28 2026
For Friday there will be some dips as the rally from Thursday will probably give back some of the individual stock gains made. The Fed’s speech from Jackson Hole is slated to start at 10:00 AM. I am not expecting anything new. The Fed is determined to get inflation lower and believes raising interest rates will do that. However with the mid-terms coming up in November, I personally think the chance of any rate hike is slim until after the mid-terms.
Earnings from Marvell beat estimates but only slightly and with investors having high expectations for the stock, it moved lower after hours as investors sold the earnings release. This will weigh on the tech sector on Friday, at least early morning. I think the Fed speech will be a non-event today. There is a good chance the SPX will end the day lower to flat.
Potential Economic and Political Market Moving Events
Monday:
No reports
Tuesday:
10:00 New Home Sales for July were lower than estimated coming in at 607,000
10:00 Conference Board Consumer Confidence for August fell more than estimated to 89.4
Wednesday:
8:30 Durable goods for July came in much higher than estimated at 1.1% versus 0.3% prior
8:30 2nd estimated GDP for second quarter came in unchanged at 1.5%
8:30 Personal income for July beat estimates rising to 0.4%
8:30 Consumer spending best estimates coming in at 0.2%
8:30 Personal Consumption Expenditures price index for July rose to 0.2% beating estimates
8:30 PCE price index year-over-year is estimated rose to 3.7% beating estimates
8:30 PCE Core price index (month to month) for July came in as estimated at 0.2%
8:30 PCE Core Prince index year-over-year for July came in below estimates at 3.3% unchanged
Thursday:
8:30 Weekly Initial Unemployment Insurance Claimswere slightly lower than estimated at 203,000
8:30 Advance Trade Balance in Goods for July was lower than estimated at -118.80 billion
8:30 Wholesale inventories for July were higher than estimated at 1.3%
8:30 Retail inventories for July rose more than estimated to 0.7%
Friday:
10:00 Fed Chair Kevin Warsh speaks from Jackson Hole