

Prior Trading Day Summary
On Friday Aug 28 2026 markets tried to rally but in the end finished the day slightly negative thanks in large part to Fed Chair Warsh’s speech outlining the Fed concern with inflation. This brought back worries of a Fed rate hike as soon as September. For the week though both indexes closed positive.
The SPX fell 19 points to close at 7711 on volume of 4.4 billion. By the close 41% of stocks were climbing. For the week though the index was up 37 points.
The NASDAQ slipped 139 points to 26402. Volume was 8.7 billion with only 30% of stocks on the index rising by the close. For the week the NASDAQ was up 222 points.
Let’s review the SPX closing technical indicators from Fri Aug 28 2026 to see what they predict for Mon Aug 31 2026.
Stock Market Outlook: SPX Closing Chart For Thu Aug 27 2026
The index ended the day below the Upper Bollinger Band and just above the 21 day moving average. This is bearish.
The closing candlestick is bearish for Monday with a small shadow which suggests dips are likely.
The 21 day moving average is rising and closed at 7701. This is bullish.
The 50 day moving average is rising and closed at 7563. This is bullish.
The 100 day moving average is rising and closed at 7419. This is bullish.
The 200 day moving average is rising and closed at 7159. This is bullish.
The Lower Bollinger Band is above the 100 day moving average and the 50 day moving average which is bearish. The Upper Bollinger Band is falling which is bearish. Signals are advising stocks may pullback further.
The SPX chart is more bearish than bullish for the final trading day of August.
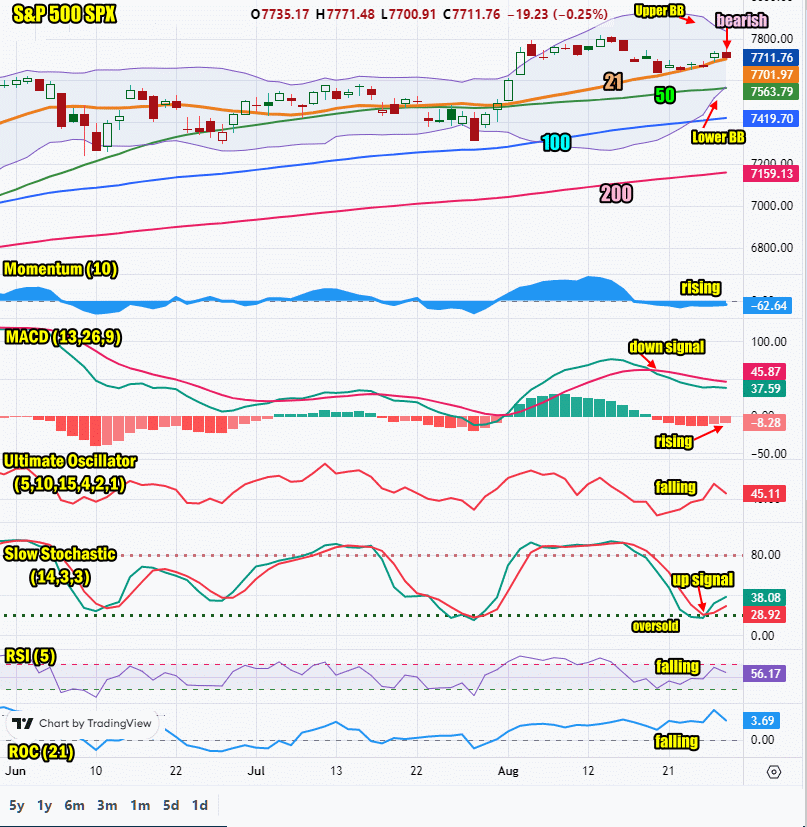
SPX Stock Market Outlook review of Fri Aug 28 2026
Stock Market Outlook: Technical Indicators Review
Momentum: Momentum is rising and negative. This is bearish.
|
MACD Histogram: MACD (Moving Averages Convergence / Divergence) issued an down signal on Thu Aug 20 2026. On Fri Aug 28 2026 the down signal lost some strength.
|
Ultimate Oscillator: The Ultimate Oscillator is falling which is bearish.
|
Slow Stochastic: The Slow Stochastic has an up signal in place which is bullish.
|
Relative Strength Index: The RSI signal is falling which is bearish.
|
| Rate of Change: The rate of change is falling and signaling that Monday will end lower. Settings: Rate Of Change is set for a 21 period. This indicator looks back 21 days and compares price action from the past to the present. With the Rate Of Change, prices are rising when signals are positive. Conversely, prices are falling when signals are negative. As an advance rises, the Rate Of Change signal should also rise higher, otherwise the rally is suspect. A decline should see the Rate Of Change fall into negative signals. The more negative the signals the stronger the decline. |
Stock Market Outlook: Support and Resistance Levels |
| 7800 is resistance |
| 7780 is resistance |
| 7750 is resistance |
| 7700 is resistance |
| 7650 is resistance |
| 7600 is resistance |
| 7590 is resistance |
| 7570 is resistance |
| 7550 is resistance |
| 7500 is support |
| 7450 is support |
| 7425 is support |
| 7400 is support |
Stock Market Outlook for Mon Aug 31 2026
This week we get earnings from a number of important names that could swing markets. These include Palo Alto Networks, Dell Technologies, MongoDB, Medtronic, Broadcom, Snowflake, Hewlett Packard Enterprise, NetApp and others. On Friday Sep 4 we get the August Non-Farm Payroll Numbers. This will be a choppy week thanks as well to rising oil prices and continued fighting in the war with Iran. All of these will weigh on stocks this week.
On Monday watch for weakness and dips. The day is expected to end lower.
Potential Economic and Political Market Moving Events
Monday:
No reports