

Prior Trading Day Summary
On Mon Jul 20 2026 stocks continued their decline but losses were minimal. The close however saw a confirmation of the MACD down signal.
The SPX closed down 14 points to 7443 . Trading volume was light at 5.2 billion with 61% of stocks on the index falling by the close.
The NASDAQ fell 12 points to 25,508. Volume fell to 7.4 billion shares traded. The close saw 63% of stocks falling.
In general the technical indicators turned more bearish to start the week.
Let’s review the closing technical indicators from Mon Jul 20 2026 to see what they predict for Tue Jul 21 2026.
Stock Market Outlook: SPX Closing Chart For Mon Jul 20 2026
The index ended the day below both the 21 day and 50 day moving averages for a second day. This is bearish.
The closing candlestick is bearish for Tuesday but still signaling that a bounce is possible.
The 21 day moving average is unchanged and closed at 7477. It is nearing the 50 day moving average.This is bearish.
The 50 day moving average is rising and closed at 7466. This is bullish.
The 100 day moving average is rising and closed at 7245. This is bullish.
The 200 day moving average is rising and closed at 6997. This is bullish.
The Lower Bollinger Band is falling. The Upper Bollinger Band is falling. The Bollinger Bands Squeeze is ending but signals are now showing a better chance stocks will fall as the Bollinger Bands Squeeze ends.
The SPX chart is more bearish than bullish for Tue Jul 21 2026.
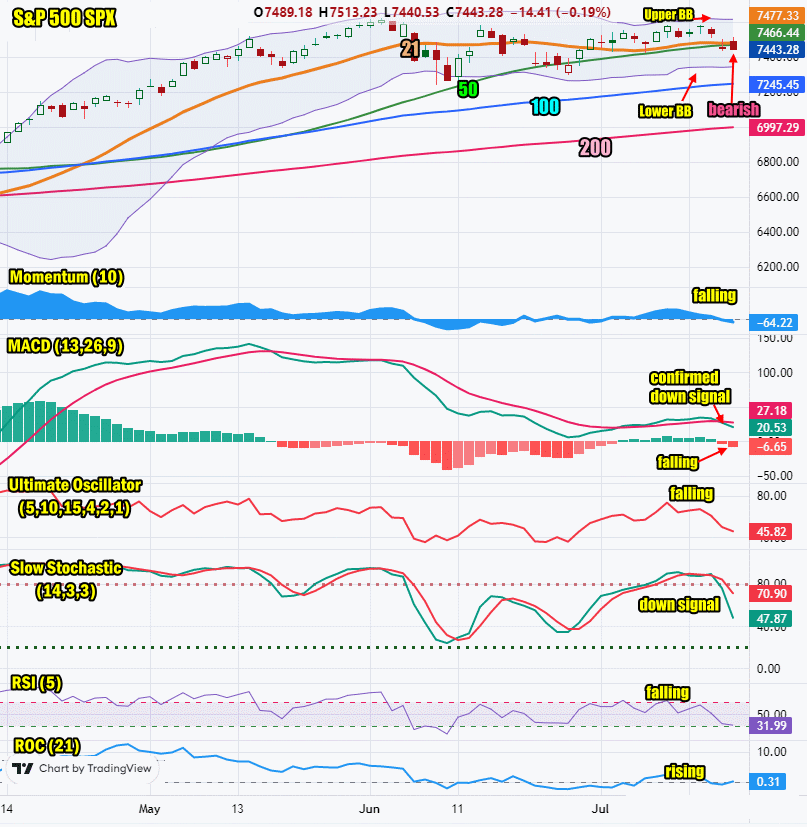
SPX Stock Market Outlook review of Mon Jul 20 2026
Stock Market Outlook: Technical Indicators Review
Momentum: Momentum is falling and negative. This is bearish.
|
MACD Histogram: MACD (Moving Averages Convergence / Divergence) issued a down signal on Fri Jul 17 2026. On Mon Jul 20 2026 the down signal was confirmed.
|
Ultimate Oscillator: The Ultimate Oscillator is falling which is bearish.
|
Slow Stochastic: The Slow Stochastic has a down signal in place which is bearish.
|
Relative Strength Index: The RSI signal is falling which is bearish.
|
| Rate of Change: The rate of change is rising signaling Tuesday will end higher. Settings: Rate Of Change is set for a 21 period. This indicator looks back 21 days and compares price action from the past to the present. With the Rate Of Change, prices are rising when signals are positive. Conversely, prices are falling when signals are negative. As an advance rises, the Rate Of Change signal should also rise higher, otherwise the rally is suspect. A decline should see the Rate Of Change fall into negative signals. The more negative the signals the stronger the decline. |
Stock Market Outlook: Support and Resistance Levels |
| 7600 is resistance |
| 7590 is resistance |
| 7570 is resistance |
| 7550 is resistance |
| 7500 is resistance |
| 7450 is resistance |
| 7425 is resistance |
| 7400 is resistance |
| 7370 is support |
| 7350 is support |
| 7300 is support |
| 7280 is support |
| 7250 is support |
| 7200 is support |
| 7175 is support |
| 7150 is support |
| 7125 is support |
| 7100 is good support |
Stock Market Outlook for Tue Jul 21 2026
More earnings arrive today and into the remainder of the week from a number of companies including big cap names like GM, 3M, Charles Schwab, Intel, Northrop Grumman and many more. As earnings come in, the general consensus is that earnings will beat estimates and that should assist in sending stocks back up. Rising bond yields did not help stocks on Monday but in general the bullish bias remains very strong with investors even though most of the technical indicators are bearish. Dips are still being seen by many investors as opportunities to get into further trades.
Tuesday should see a higher close but even a drop today won’t alter the bullish bias. I expect the week could end higher. After hours the White House announced large tariffs of 50% on goods coming from Canada no matter where they originated from. I don’t think this will impact stocks at present. Many investors believe these tariffs will never be implemented or will be challenged.
Potential Economic and Political Market Moving Events
Monday:
10:00 Leading indicators for Jun came in lower than estimated at -0.2%
Tuesday:
no reports issues