
Prior Trading Day Summary
On Fri Jul 17 2026 stock indexes fell further as the sell-off spread.
The SPX closed down 76 points to 7457 . Trading volume was 5.4 billion with 64% of stocks on the index falling by the close. For the week the index lost 117 points with sentiment staying bearish to start the week.
The NASDAQ with its heavy chip presence fell 361 points to 25,520. Volume fell to 8.0 billion shares traded. The close saw 62% of stocks falling. For the week the index was down 761 points.
With momentum shifting to even more bearish on Friday, the MACD technical indicator changed back to a down signal, although it is unconfirmed to start the week.
Let’s review the closing technical indicators from Fri Jul 17 2026 to see what they predict for the start of the 4th week of July.
Stock Market Outlook: SPX Closing Chart For Fri Jul 17 2026
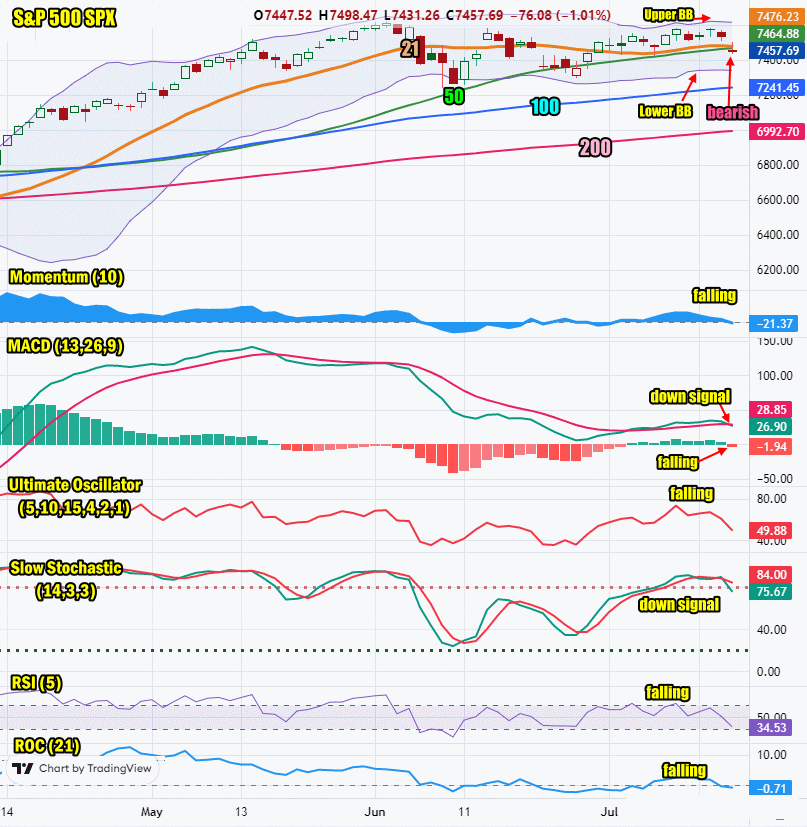
The index ended the day below both the 21 day and 50 day moving averages. The SPX closed near the lows on Friday. This is bearish.
The closing candlestick is bearish for Monday but with one long shadow indicating a bounce is likely, probably in the morning..
The 21 day moving average is falling and closed at 7476. It is nearing the 50 day moving average.This is bearish.
The 50 day moving average is rising and closed at 7464. This is bullish.
The 100 day moving average is rising and closed at 7241. This is bullish.
The 200 day moving average is rising and closed at 6992. This is bullish.
The Lower Bollinger Band is trending sideways. The Upper Bollinger Band is falling. The Bollinger Bands Squeeze is ending but signals are now showing a better chance stocks will fall as the Bollinger Bands Squeeze ends.
The SPX chart is more bearish than bullish for Mon Jul 20 2026.
SPX Stock Market Outlook review of Fri Jul 17 2026
Stock Market Outlook: Technical Indicators Review
Momentum: Momentum is falling and negative. This is bearish.
|
MACD Histogram: MACD (Moving Averages Convergence / Divergence) issued an up signal on Mon Jul 6 2026. On Fri Jul 17 2026 an unconfirmed down signal was issued..
|
Ultimate Oscillator: The Ultimate Oscillator is falling which is bearish.
|
Slow Stochastic: The Slow Stochastic has a down signal in place which is bearish.
|
Relative Strength Index: The RSI signal is falling which is bearish.
|
| Rate of Change: The rate of change is falling signaling Monday will end lower. Settings: Rate Of Change is set for a 21 period. This indicator looks back 21 days and compares price action from the past to the present. With the Rate Of Change, prices are rising when signals are positive. Conversely, prices are falling when signals are negative. As an advance rises, the Rate Of Change signal should also rise higher, otherwise the rally is suspect. A decline should see the Rate Of Change fall into negative signals. The more negative the signals the stronger the decline. |
Stock Market Outlook: Support and Resistance Levels |
| 7600 is resistance |
| 7590 is resistance |
| 7570 is resistance |
| 7550 is resistance |
| 7500 is resistance |
| 7450 is resistance |
| 7425 is resistance |
| 7400 is resistance |
| 7370 is support |
| 7350 is support |
| 7300 is support |
| 7280 is support |
| 7250 is support |
| 7200 is support |
| 7175 is support |
| 7150 is support |
| 7125 is support |
| 7100 is good support |
Stock Market Outlook for Mon Jul 20 2026
Over the weekend oil prices continued to climb. This is continuing to be bearish for stocks. Monday looks ready to try a technical bounce but the signals are advising any bounce on Monday will fail.
A new down signal on Friday from the MACD technical indicator has to be confirmed before changing the outlook to lower.
Monday looks set to attempt a bounce, probably in the morning but the technical indicators are advising that any bounce won’t work but will fail.
Potential Economic and Political Market Moving Events
Monday:
10:00 Leading indicators for Jun are estimated to fall to 0%, down from 0.1% prior