

FullyInformed.com
Generic filters
Exact matches only
Search in title
Search in content
Search in excerpt

Stock Market Outlook For Tue Feb 3 2026 – Bounce and Higher

Feb 3, 2026 | Stock Market Outlook

Prior Trading Day Summary

On Monday indexes opened lower with the SPX falling below the 21 day moving average but finding buyers ready. Many of the buyers probably missed the last bounce and didn’t want to wait for any move closer to the 50 day moving average. Buying was relatively swift although choppy at times.

The SPX ended the day up 37 points to close at 6974. Volume was lower by a billion shares from Friday’s trading but 57% of stocks were climbing by the close.

The NASDAQ rose by 130 points to close at 23,592 on 9.1 billion shares traded, 500 million less than we saw on Friday. 56% of all stocks were rising by the close.

Despite the lower volume, trading action was reasonably swift which usually points to a higher follow-up day for Tuesday. This Friday’s January non-farm payroll report will not be released and no firm date has been set for when it will be.

Let’s review the closing technical indicators for Mon Feb 2 2026 to see what to expect for Tue Feb 3 2026.


Stock Market Outlook: SPX Closing Chart For Mon Feb 2 2026 

The index closed above the Lower Bollinger Band andall major moving averages which is bullish.

The closing candlestick is bullish for Tuesday with a small shadow which indicates a bit of choppiness is probably today.

The 21 day moving average is rising and closed at 6931. This is bullish.

The 50 day moving average is rising and closed at 6864. This is bullish.

The 100 day moving average is rising and closed at 6752 which is bullish.

The 200 day moving average is rising and closed at 6510 which is bullish.

The Lower Bollinger Band is turning higher which is bullish. The Upper Bollinger Band is also higher which is bullish. The Bollinger Bands Squeeze is is still in play and stocks look set to move higher out of the present squeeze.

The SPX chart is more bullish than bearish for Tuesday.
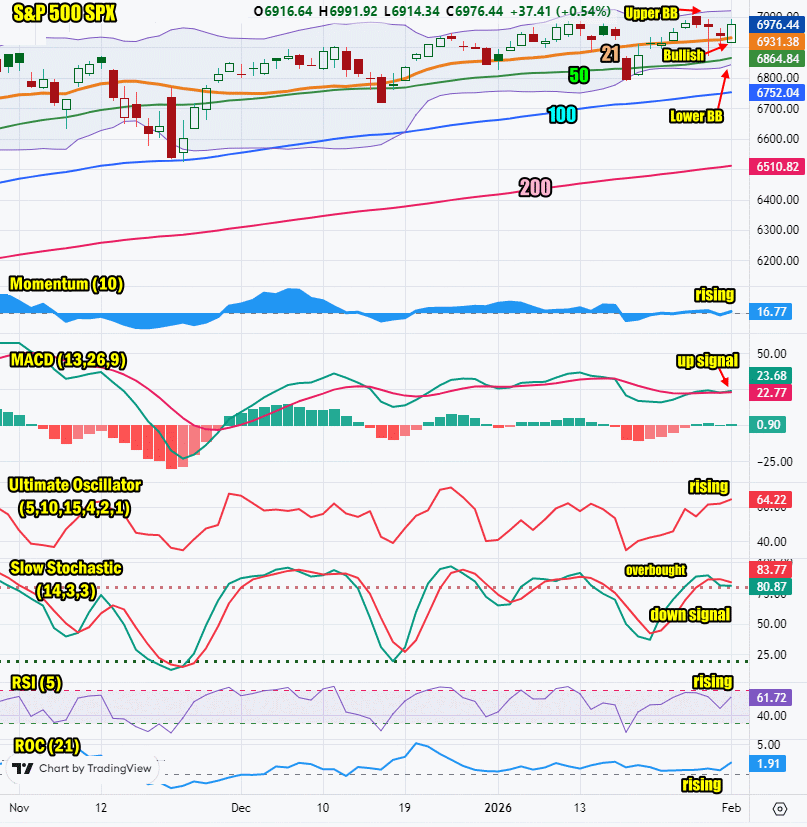
SPX Stock Market Outlook review of Mon Feb 2 2026


Stock Market Outlook: Technical Indicators Review

Momentum: Momentum is rising and positive. This is bullish.

  • Settings: For momentum I use a 10 period when studying market direction.
MACD Histogram: MACD (Moving Averages Convergence / Divergence) issued an up signal on Wed Jan 28 2026. Monday’s higher close left behind a weak up signal.

  • Settings: For MACD Histogram, I am using the Fast Points set at 13, Slow Points at 26 and Smoothing at 9.
Ultimate Oscillator: The Ultimate Oscillator is still rising

  • Settings: The Ultimate Oscillator settings are: Period 1 is 5, Period 2 is 10, Period 3 is 15, Factor 1 is 4, Factor 2 is 2 and Factor 3 is 1. These are not the default settings but are the settings I use with the S&P 500 chart set for 1 to 3 months.
Slow Stochastic: The Slow Stochastic has a down signal in place and is falling from overbought.

  • Settings: For the Slow Stochastic I use the K period of 14 and D period of 3. The Slow Stochastic tries to predict the market direction further out than just one day.
Relative Strength Index: The RSI signal is rising.

  • Settings: The relative strength index is set for a period of 5 which gives it 5 days of market movement to monitor. It is often the first indicator to show an overbought or oversold signal.
Rate of Change: The rate of change is rising and signaling a higher close for today.

Settings: Rate Of Change is set for a 21 period. This indicator looks back 21 days and compares price action from the past to the present. With the Rate Of Change, prices are rising when signals are positive. Conversely, prices are falling when signals are negative. As an advance rises, the Rate Of Change signal should also rise higher, otherwise the rally is suspect. A decline should see the Rate Of Change fall into negative signals. The more negative the signals the stronger the decline.


Stock Market Outlook: Support and Resistance Levels

7025 is resistance
7000 is resistance
6950 is resistance
6925 is resistance
6900 is resistance
6875 is resistance
6850 is resistance
6800 is resistance
6775 is support
6750 is support
6725 is support
6700 is support
6675 is support
6650 is support
6625 is support
6600 is support


Stock Market Outlook for Tue Feb 3 2026 

For Tuesday the SPX signals are pointing to a higher day and close as Monday’s bounce is set to continue. We could see a close near 7000 today.

Most of the technical signals are shifting back to the bullish side despite volume dropping on Monday.

On Monday after the close Palantir Tech Stock (PLTR) rose on the back of better than estimated earnings. This should help the index on Tuesday.

On Monday the economic reports were better than estimated and all pointed to the economy expanding further in January.

For Tuesday, watch for a choppy day but with Monday’s bounce continuing to a higher close.


Potential Economic and Political Market Moving Events

Monday:

9:45 S&P flash manufacturing PMI for Jan was higher than estimated at 52.4 versus 51.8 prior

10:00 ISM manufacturing for Jan was far stronger than estimated coming in at 52.6%up from 47.9% prior

During the day we got auto sales which rose 2% to 16.2 million, a slight beat but still a decent performance

Tuesday:

10:00 Job openings for Dec (delayed) are estimated at 7.1 million


Recent Outlooks

Stock Market Outlook For Wed Jul 22 2026 – Higher Ahead of Alphabet Earnings

Prior Trading Day Summary On Tue Jul 21 2026 stocks bounced higher and recovered to close back above the 21 and 50 day moving averages. The SPX closed up 66 points to 7509 . Trading volume was better at 5.3 …

Morning Investing Strategy Notes for Tue Jul 21 2026

For FullyInformed Members the morning Investing Strategy Notes for Tue Jul 21 2026 review the outlook following small losses on the indexes yesterday. Equities discussed today include Netflix Stock (NFLX), UnitedHealth Group Stock (UNH), IWM ETF, SPY ETF, Capital One …

Stock Market Outlook For Tue Jul 21 2026 – Confirmed MACD Down Signal

Prior Trading Day Summary On Mon Jul 20 2026 stocks continued their decline but losses were minimal. The close however saw a confirmation of the MACD down signal. The SPX closed down 14 points to 7443 . Trading volume was …

Morning Investing Strategy Notes for Mon Jul 20 2026

For FullyInformed Members the morning Investing Strategy Notes for Mon Jul 20 2026 review the outlook. Equities discussed today include Netflix Stock (NFLX), UnitedHealth Group Stock (UNH), 3M Company Stock (MMM) and more. The morning Investing Strategy Notes are for …

Stock Market Outlook For Mon Jul 20 2026 – Possible Bounce But Unconfirmed MACD Down Signal To Start The Week

Prior Trading Day Summary On Fri Jul 17 2026 stock indexes fell further as the sell-off spread. The SPX closed down 76 points to 7457 . Trading volume was 5.4 billion with 64% of stocks on the index falling by …

Morning Investing Strategy Notes for Fri Jul 17 2026

For FullyInformed Members the morning Investing Strategy Notes for Fri Jul 17 2026 review the outlook for Friday and Monday next week. Equities discussed today include Netflix Stock (NFLX), United Airlines Stock (UAL), UnitedHealth Group Stock (UNH), Microsoft Stock (MSFT), …

Stock Market Outlook For Fri Jul 17 2026 – Bias Is Lower To End The Week – Netflix Disappoints

Prior Trading Day Summary On Thu Jul 16 2026 stock indexes gave back the latest gains as chip stocks fell again and the selling widened to encompass a few more names. The SPX closed down 38 points to 7533 …

Morning Investing Strategy Notes for Thu Jul 16 2026

For FullyInformed Members the morning Investing Strategy Notes for Thu Jul 16 2026 review the continuation of Tuesday’s rally on Wednesday. Equities discussed today include  United Airlines Stock (UAL), UnitedHealth Group Stock (UNH), Microsoft Stock (MSFT), Intuitive Surgical Stock (ISRG) …

Stock Market Outlook For Thu Jul 16 2026 – Dips Likely But Higher Close

Prior Trading Day Summary On Wed Jul 15 2026 stocks climbed higher again despite chip stocks tumbling across most names in what was a broad sell-off. Some of the sell-off is a result of IBM Stock plunging on Tuesday. On …

Morning Investing Strategy Notes for Wed Jul 15 2026

For FullyInformed Members the morning Investing Strategy Notes for Wed Jul 15 2026 discuss the rally on Tuesday and outlook for today. Included are comments on the International Business Machines Stock (IBM) plunge. Equities discussed today include Morgan Stanley Stock …

Stock Market Outlook For Wed Jul 15 2026 – Mixed Outlook After Bank Earnings and IBM Plunge

Prior Trading Day Summary On Tue Jul 14 2026 bank earnings along with tech stocks help drive the indexes higher. A 25% plunge in International Business Machines Stock (IBM) shook investors which kept any rally in check. The SPX closed …

Morning Investing Strategy Notes for Tue Jul 14 2026

For FullyInformed Members the morning Investing Strategy Notes for Tue Jul 14 2026 discuss the expected outlook for the next few days for stocks. Equities discussed today include Bank Of America Stock (BAC), Wells Fargo Stock (WFC), Citigroup Stock (C), …

Stock Market Outlook For Tue Jul 14 2026 – All About Bank Earnings

Prior Trading Day Summary On Mon Jul 13 2026 indexes spent the day in the red giving back some of last week’s gains. The SPX closed down 60 points to 7515 . Trading volume was low at 4.8 billion with …

Morning Investing Strategy Notes for Mon Jul 13 2026

For FullyInformed Members the morning Investing Strategy Notes for Mon Jul 13 2026 discuss the upcoming week for stocks. Equities discussed today include Bank Of America Stock (BAC), Wells Fargo Stock (WFC), Citigroup Stock (C), NVIDIA Stock (NVDA) and more …

Subscribe For The Latest News