
FullyInformed.com
Generic filters

Stock Market Outlook For Tue Aug 11 2026 – Still Bullish Ahead Of Wednesday’s CPI Numbers

Aug 11, 2026 | Stock Market Outlook

Stock Market Outlook still bullish


Prior Trading Day Summary

On Mon Aug 10 2026 stocks had a seesaw day as investors weighed the continued drama over the Strait of Hormuz and prepared for the CPI numbers due out Wednesday at 8:30. These will give the latest read on inflation. After the July Non-Farm Payroll Numbers surprised with a loss for the month, a lower CPI number would cement the arguments against the Fed raising interest rates in September.

The SPX ended the day almost flat, losing just 4 points to close at 7753. Volume was 5 billion shares with 52% of all trading volume advancing but only 38% of stocks rising by the close.

The NASDAQ slipped 85 points ending the day at 26,605. Volume was low at 7.9 billion. By the close 47% of all volume was advancing but just 39% of stocks were rising.

Let’s review the technical indicators from the close of Mon Aug 10 2026 to see what they predict for Tue Aug 11 2026.


Stock Market Outlook: SPX Closing Chart For Mon Aug 10 2026 

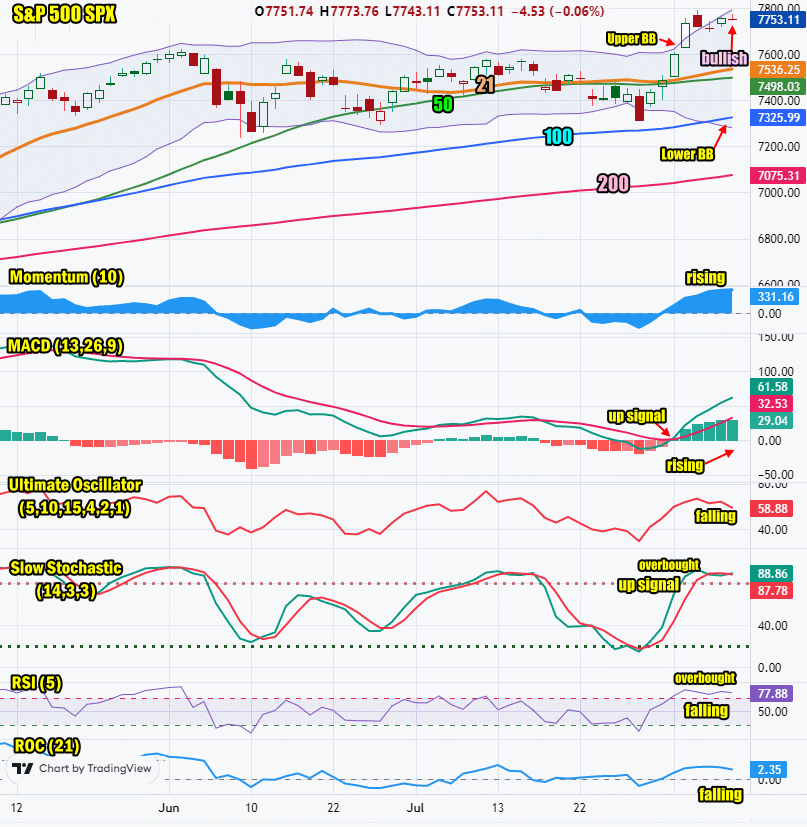
The index ended the day just below the Upper Bollinger Band which is bullish.

The closing candlestick has a long shadow which signals a bounce is likely on Tuesday, possibly in the morning or near the open. This is bullish.

The 21 day moving average is rising and closed at 7536. This is bullish.

The 50 day moving average is rising and closed at 7498. This is bullish.

The 100 day moving average is rising and closed at 7325. This is bullish.

The 200 day moving average is rising and closed at 7075. This is bullish.

The Lower Bollinger Band is falling and now below the 100 day moving average which is bullish. The Upper Bollinger Band is rising. The signal is bullish for stocks.

The SPX chart is bullish for Tue Aug 11 2026.
SPX Stock Market Outlook review of Mon Aug 10 2026


Stock Market Outlook: Technical Indicators Review

Momentum: Momentum is rising and positive. This is bullish.

  • Settings: For momentum I use a 10 period when studying market direction.
MACD Histogram: MACD (Moving Averages Convergence / Divergence) issued an up signal on Mon Aug 3 2026. The up signal was stronger on Mon Aug 10 2026.

  • Settings: For MACD Histogram, I am using the Fast Points set at 13, Slow Points at 26 and Smoothing at 9.
Ultimate Oscillator: The Ultimate Oscillator is falling which is bearish.

  • Settings: The Ultimate Oscillator settings are: Period 1 is 5, Period 2 is 10, Period 3 is 15, Factor 1 is 4, Factor 2 is 2 and Factor 3 is 1. These are not the default settings but are the settings I use with the S&P 500 chart set for 1 to 3 months.
Slow Stochastic: The Slow Stochastic has an up signal in place which is bullish. It is overbought.

  • Settings: For the Slow Stochastic I use the K period of 14 and D period of 3. The Slow Stochastic tries to predict the market direction further out than just one day.
Relative Strength Index: The RSI signal is falling and overbought. This is bearish.

  • Settings: The relative strength index is set for a period of 5 which gives it 5 days of market movement to monitor. It is often the first indicator to show an overbought or oversold signal.
Rate of Change: The rate of change is falling which is bearish. It is signaling Tuesday will end lower.

Settings: Rate Of Change is set for a 21 period. This indicator looks back 21 days and compares price action from the past to the present. With the Rate Of Change, prices are rising when signals are positive. Conversely, prices are falling when signals are negative. As an advance rises, the Rate Of Change signal should also rise higher, otherwise the rally is suspect. A decline should see the Rate Of Change fall into negative signals. The more negative the signals the stronger the decline.


Stock Market Outlook: Support and Resistance Levels

7800 is resistance
7780 is resistance
7750 is resistance
7700 is resistance
7650 is resistance
7600 is resistance
7590 is resistance
7570 is resistance
7550 is resistance
7500 is resistance
7450 is resistance
7425 is resistance
7400 is support
7370 is support
7350 is support
7300 is support
7280 is support
7250 is support
7200 is support


Stock Market Outlook for Tue Aug 11 2026 

For Tue Aug 11 2026 the outlook is bullish for stocks with a bounce likely in the morning. News of a $500 billion partnership with NVIDIA Stock (NVDA) and six Wall Street principal banks to build out AI infrastructure should be enough to get the market excited for the start of the day.

The bigger news for many investors will come on Wednesday before the open of trading when the latest CPI numbers are released. This will be the latest inflation reading and many investors are staying cautious ahead of those numbers as they expect a potential interest rate hike in September if the CPI numbers are higher than estimated.

For Tuesday though the outlook is for a higher close, even just slightly.


Potential Economic and Political Market Moving Events

Monday:

No events

Tuesday:

10:00 Existing Home Sales for June estimated to slip to 4.0 million from 4.1 million prior

Wednesday:

8:30 CPI for Jul estimated to rise 0.1% from -0.4% prior

8:30 Core CPI Month over month for July estimated to rise 0.2% from 0% prior

8:30 CPI Year-over-year for July estimated to slip to 3.4% from 3.5% prior

8:30 CPI Core year-over-year for July estimated to slip 2.5% from 2.6% prior


Recent Outlooks

Stock Market Outlook For Thu Aug 13 2026 – Mixed Outlook For Second Day Ahead Of PPI Numbers

Prior Trading Day Summary On Wed Aug 12 2026 the July CPI numbers came in as estimated but did not show inflation is taking off. Stocks tried to rally off the news but with the latest PPI numbers due of …

Morning Investing Strategy Notes for Wed Aug 12 2026

For FullyInformed Members the morning Investing Strategy Notes for Wed Aug 12 2026 review the outlook for Wed Aug 12 2026 with the release of the July CPI numbers. There are a number of equity trades today. Stocks include Coreweave …

Stock Market Outlook For Wed Aug 12 2026 – Mixed Outlook Ahead Of Latest CPI Numbers

Prior Trading Day Summary On Tue Aug 11 2026 stocks continued to see light selling pressure as investors wait for more information on the Strait of Hormuz reopening and the latest CPI numbers today before the open. The SPX ended …

Morning Investing Strategy Notes for Tue Aug 11 2026

For FullyInformed Members the morning Investing Strategy Notes for Tue Aug 11 2026 review the outlook for Tue Aug 11 2026, one day ahead of the latest CPI numbers which are due out Wed Aug 12 2026 before the start …

Morning Investing Strategy Notes for Mon Aug 10 2026

For FullyInformed Members the morning Investing Strategy Notes for Mon Aug 10 2026 review the outlook for the start of the second week of August. There are a number of equity trades today. Stocks include Goldman Sachs Stock (GS), Berkshire …

Stock Market Outlook For Mon Aug 10 2026 – Choppy Bias Higher

Prior Trading Day Summary On Fri Aug 6 2026 the initial reaction from investors on the surprising loss of jobs as reported by the July Non-Farm Payroll Numbers report was negative but by 10:15 stocks had already seen the day’s …

Morning Investing Strategy Notes for Fri Aug 7 2026

For FullyInformed Members the morning Investing Strategy Notes for Fri Aug 7 2026 look at the July Non-Farm Payroll Numbers and their possible affect on trading today. There are a number of equity trades today. Stocks include AIRBNB Stock (ABNB), …

Stock Market Outlook For Fri Aug 7 2026 – All About The July Jobs Numbers

Prior Trading Day Summary On Thu Aug 6 2026 stocks continued to stay bullish but not advance as investors waited for the July Non-Farm Payroll Numbers due out today at 8:30. The SPX fell 13 points to close at 7709 …

Morning Investing Strategy Notes for Thu Aug 6 2026

For FullyInformed Members the morning Investing Strategy Notes for Thu Aug 6 2026 discuss the state of the rally after stocks took a breather on Wednesday. There are a large number of equity trades today. Stocks include Expedia Stock (EXPE), …

Stock Market Outlook For Thu Aug 6 2026 – Overbought – Dips Likely – Flat to Higher Close

Prior Trading Day Summary On Tue Aug 4 2026 the rally took a breather but the Dow Jones and NASDAQ both made interim new all-time highs. The S&P was 7 points intraday from reaching 7800. The SPX slipped 13 points …

Morning Investing Strategy Notes for Wed Aug 5 2026

For FullyInformed Members the morning Investing Strategy Notes for Wed Aug 5 2026 review the two-day rally and the cautionary signals being generated. There are a large number of equity trades today. Stocks include Advanced Micro Devices Stock (AMD), Uber …

Stock Market Outlook For Wed Aug 5 2026 – Confirmed MACD Up Signal – Overbought

Prior Trading Day Summary On Tue Aug 4 2026 stocks roared higher on good volume as investors poured capital into a broad array of stocks with tech names still leading. By the close on Tuesday, the MACD up signal from …

Morning Investing Strategy Notes for Tue Aug 4 2026

For FullyInformed Members the morning Investing Strategy Notes for Tue Aug 4 2026 review the rally from yesterday and the chance it will continue today. There are a large number of equity trades today. Stocks include Palantir Tech Stock (PLTR), …

Stock Market Outlook For Tue Aug 4 2026 – Overbought But Still Higher

Prior Trading Day Summary On Mon Aug 3 2026 oil prices fell as did bond yields. This seemed to be enough to keep investors buying the rally and pushing stocks still higher. The SPX rose 110 points to close at …

Subscribe For The Latest News