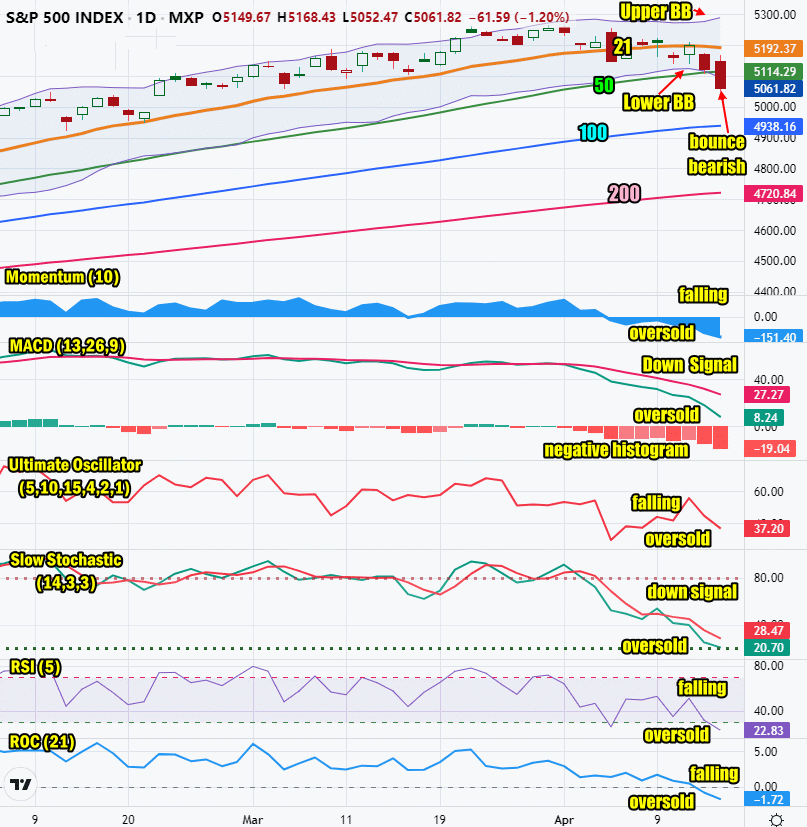
 Prior Trading Day Summary:
Monday started the day as expected with a massive rally at the open and a push higher especially when retail sales came in stronger than expected. However as news continued to focus on Iran and Israel’s potential conflict escalating investors sold stocks lower easily breaking through the 50 period support level, then falling below 5100 and continuing to break down to 5050. Volumes picked up as selling intensified and by the end of the day the SPX was down 61 points to 5061. The NASDAQ dropped 290 points matching Friday’s drop and ending the day at 15885.
Down volume on the SPX was 78% and 79% of all stocks were falling. On he NASDAQ 72% of all volume was being traded lower and 74% of all stocks were falling.
While investors rushed to get to the exits as stocks fell further, the indexes were flashing oversold signals. By the end of the day, all the technical indicators except MACD, were showing deeply oversold signals. Unless war breaks out on Tuesday, we should see some kind of bounce.
Let’s review the closing technical indicators on Mon Apr 15 2024 to see what to expect for Tue Apr 16 2024.
Stock Market Outlook: SPX Closing Chart For Mon Apr 15 2024
The index closed below the 50 day moving average and the Lower Bollinger Band. This usually results in a bounce attempt.
The closing candlestick is signaling deeply oversold and due to bounce. It is also bearish.
The 21 day moving average is moving lower which is bearish.
The 50 day moving average is rising and at 5114, which is bullish.
The 100 and 200 day moving averages are climbing which is bullish. The 200 day is at 4720 on the SPX which is bullish.
The Bollinger Bands are leaving the latest Bollinger Bands Squeeze with the index falling. Note that the Lower Bollinger Band fell below the 50 day moving average on Monday. This is bearish. The Upper Bollinger Band is turning higher which signals the Bollinger Bands Squeeze is ended and stocks are falling.
The S&P chart is bearish but signaling the index is deeply oversold and should bounce on Tuesday.
Stock Market Outlook: Technical Indicators Review
Momentum: Momentum is falling and negative. It is deeply oversold.
|
MACD Histogram: MACD (Moving Averages Convergence / Divergence) issued a down signal on Tue Apr 2. On Mon Apr 15 2024 the down signal gained strength. The MACD histogram is strongly negative.
|
Ultimate Oscillator: The Ultimate Oscillator is falling and oversold.
|
Slow Stochastic: The Slow Stochastic has a down signal in place. It is deeply oversold.
|
Relative Strength Index: The RSI signal is falling and deeply oversold.
|
Rate of Change: The rate of change signal is falling and oversold. It is at levels where usually investors can expect a bounce.
|
Stock Market Outlook: Support and Resistance Levels |
| 5275 is resistance |
| 5250 is resistance |
| 5225 is resistance |
| 5200 is resistance |
| 5190 is resistance |
| 5175 is resistance |
| 5150 is resistance |
| 5125 is support |
| 5115 is support |
| 5100 is support |
| 5075 is support |
| 5050 is support |
| 5025 is support |
| 5000 is light support |
| 4990 is light support |
| 4975 is light support |
| 4950 is support |
Stock Market Outlook for Tue Apr 16 2024
Looking at the support and resistance levels in the chart above you can see that Monday’s falling market broke through a number of important technical support levels. It closed just above the 5050 level and a bounce today should see the SPX reach at least 5115 or 5125. Any rally though depends on the chance of an escalation between Israel and Iran. For FullyInformed members, I used Monday’s bounce to close many positions. On Tuesday if there is a second bounce I will be closing more positions if profits can be locked away.
On Tuesday we should see a bounce at some point in the morning, but the chance the selling is over is slim at present. That means prepare for a bit more downside, if not on Tuesday by the close, then on Wednesday or Thursday. On Monday the economic reports showed the economy continues to do better than expected and that also weighed on investors who are waiting for the Fed to reduce interest rates. Retails sales and business inventories reports came in higher than expected showing the economy is still doing well. That also weighted on stocks on Monday.
Potential Economic and Political Market Moving Events
There are major events this week on every day except Friday. Wednesday we get the Fed’s Beige Book.
Monday:
8:30 Empire State manufacturing survey was expected to rise to -10.0 but instead rose to -14.3, weaker than expected.
8:30 Retails sales were expected to drop to 0.3% but rose to 0.7%
10:00 Business inventories were expected to rise to 0.4% but rose to 1.1%
10:00 Home builder confidence index came in as expected at 51, unchanged.
Tuesday:
8:30 Housing starts are expected to dip to 1.48 million
8:30 Building permits are expected to dip to 1.51 million
9:15 Industrial production for March is expected to rise to 0.4%
9:15 Capacity Utilization is estimated to rise slightly to 78.5%

