Prior Trading Day Summary
On Wednesday the latest CPI report surprised investors as Core CPI rose to 0.3% versus 0.2% the month prior and the CPI Index remained unchanged at 0.6%. Stocks sold off near the open as there were few signs of a decline in inflation. Despite this analysts eventually felt that the numbers were not “all that bad” and saw little chance for a September rate hike. That put a floor under the selling and the index eventually closed slightly higher.
On Thursday we get the Producer Price Index latest report. Many investors are hoping it will show inflation weakening or at least not increasing.
The SPX gained 5 points to close at 4467. The NASDAQ gained 40 points closing at 13,813.
Let’s review the SPX technical indicators from Wed Sep 13 2023 to see what to expect for Thu Sep 14 2023.
Stock Market Outlook: SPX Closing Chart For Wed Sep 13 2023
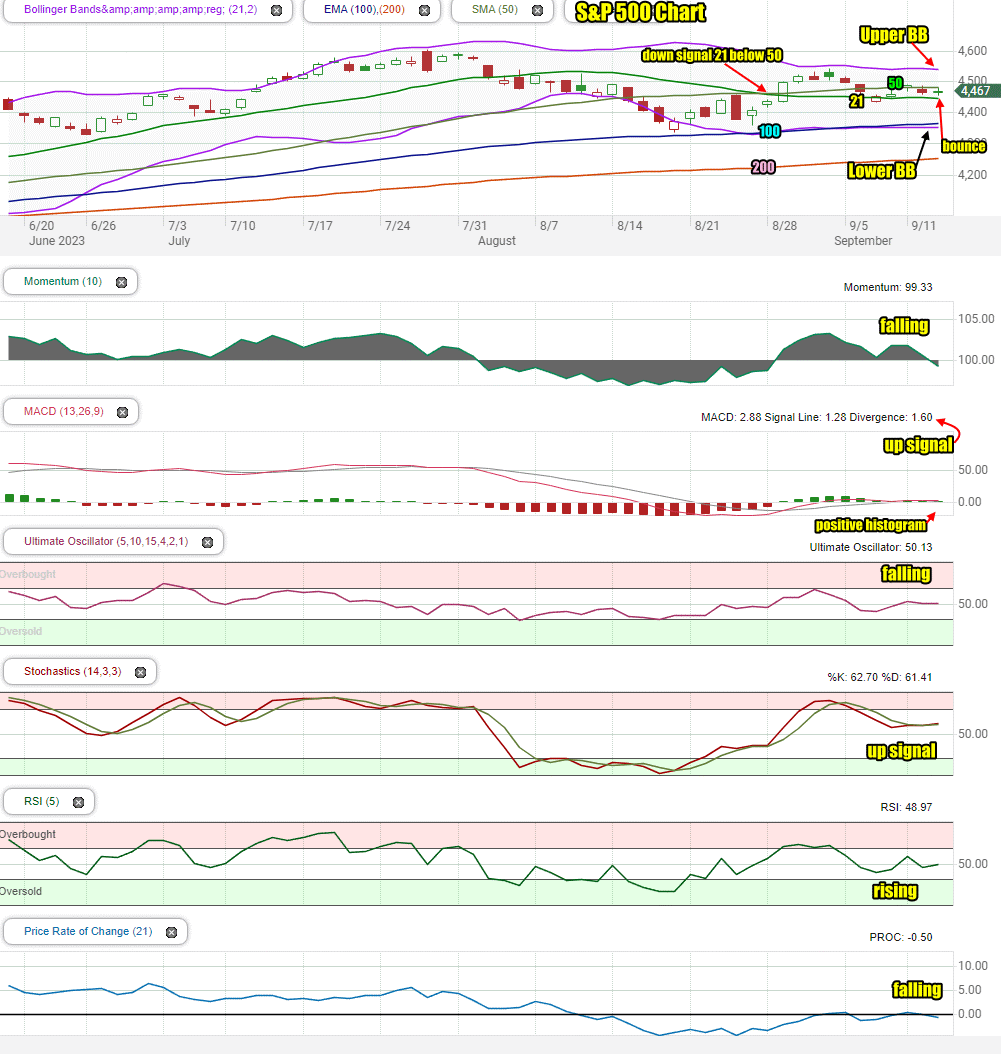
The index closed back below the 50 day which is bearish but above the 21 day moving average which is bullish.
The closing candlestick on Wednesday is once again signaling a potential bounce is likely.
The 50, 100 and 200 day moving averages are continuing to climb which is bullish.
The Lower Bollinger Band is moving below the 100 day which is bullish. The Upper Bollinger Band is is starting to slip which is bearish. The Bollinger Bands Squeeze is not yet indicating clearly which way stocks will turn.

Stock Market Outlook review of Wed Sep 13 2023
Stock Market Outlook: Technical Indicators Review
Momentum: Momentum is falling and negative.
|
MACD Histogram: MACD (Moving Averages Convergence / Divergence) issued an up signal on Tue Aug 29 2023. On Wed Sep 13 2023 the up signal was almost gone.
|
Ultimate Oscillator: The Ultimate Oscillator is falling and barely positive.
|
Slow Stochastic: The Slow Stochastic has a weak up signal.
|
Relative Strength Index: The RSI signal is rising and almost positive.
|
Rate of Change: The rate of change signal is falling and slightly negative.
|
Stock Market Outlook: Support and Resistance Levels |
| 4600 is resistance |
| 4575 is resistance |
| 4550 is resistance |
| 4525 is resistance |
| 4500 is resistance |
| 4485 is resistance |
| 4470 is resistance |
| 4450 is support |
| 4435 is support |
| 4420 is support |
| 4400 is support |
| 4390 is support |
| 4370 is support |
| 4350 is support |
Stock Market Outlook for Thu Sep 14 2023
On Wednesday the SPX held the 4450 level once again and managed to close above it. The closing candlestick is advising that a second bounce attempt is likely. However that could be tempered with the Producer Price Index reports. If they don’t show inflation unchanged or declining, stocks may slip.
This at present seems unlikely.
Potential Economic and Political Market Moving Events
This week the core CPI numbers on Wednesday and PPI numbers on Thursday will impact stocks.
Thursday:
8:30 Weekly Initial Unemployment Insurance Claims are expected to be 220,000
8:30 Producer price index is expected to rise to 0.4% up 1.10th of a percent
8:30 Core PPI is expected at 0.2% unchanged from the last report.
8:30 Core PPI year-over-year is expected at 2.7%
8:30 Retail Sales are expected to rise just 0.1%

