

On Wednesday stocks fell broadly throughout the day as investors continue their worry over the debt ceiling. The only sector that held on across most stocks was energy. However after hours NVIDIA released exceptional earnings and the stock shot higher by more than 24%, soaring $75.00 to end at $380.00 While part of that jump will be returned probably near the open, the earnings results should be enough to bounce stocks on Thursday.
The latest FOMC minutes on Wednesday showed the Fed may hold back on any interest rate increase in June but the chance of a rate cut by year-end seems unlikely.
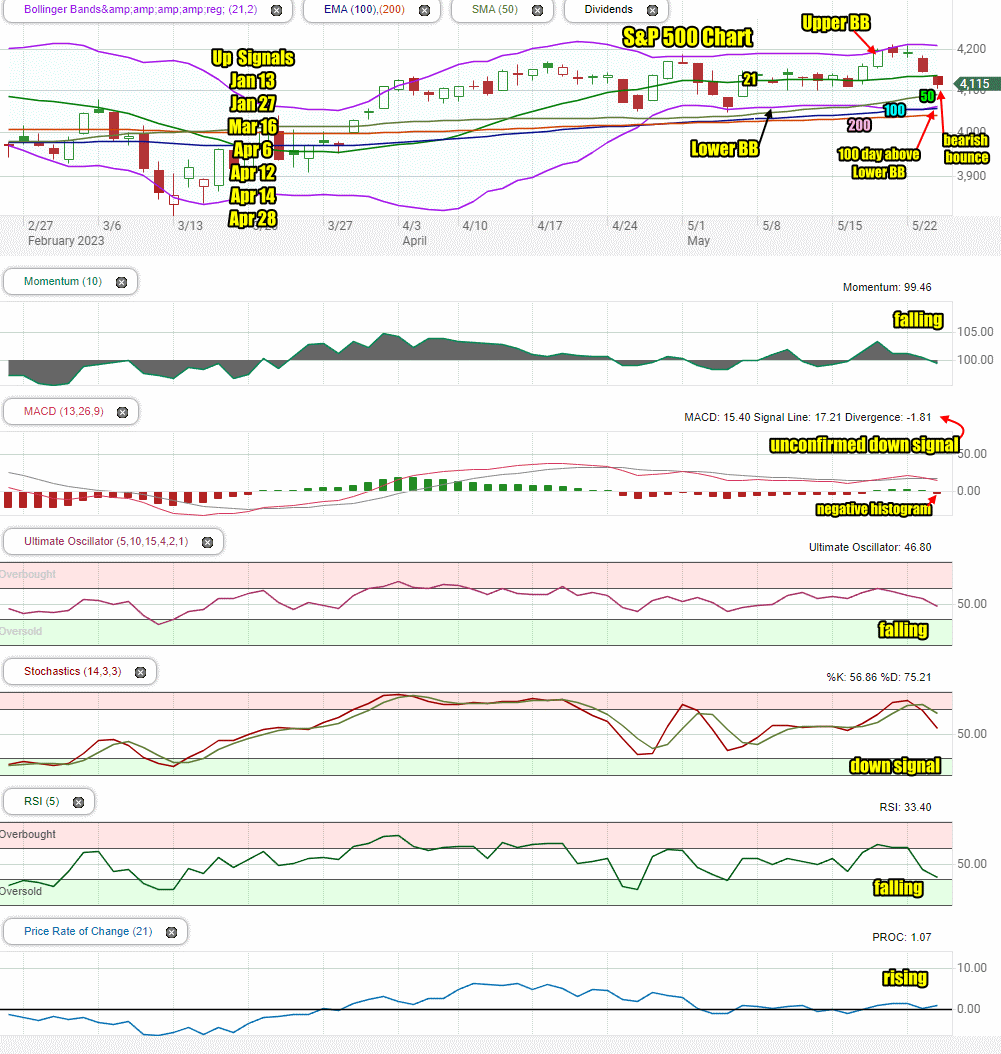
The S&P lost 30 points and ended the day at 4115.
The NASDAQ lost 76 points to end the day at 12,484.
Losses on Wednesday were less than seen on Tuesday’s sell-off.
Let’s review the SPX closing technical indicators on Wed May 24 to see what to expect for Thu May 25 2023.
Stock Market Outlook Chart Comments At The Close on Wed May 24 2023
The index closed with a bearish candlestick for Thursday but also a bounce signal.
The SPX closed below the 21 day moving average and came close to reaching the 50 day moving average intraday. This almost always signals a bounce is coming.
The 100 day moving average is still moving above the Lower Bollinger Band. This is bullish.
All major moving averages are climbing which is bullish.
The S&P chart is more bullish than bearish for Thursday.
There are 7 up signal since January and no down signal in the chart.
Stock Market Outlook review of Wed May 24 2023
Stock Market Outlook: Technical Indicators Review:
Momentum: Momentum is falling and negative.
- Settings: For momentum I use a 10 period when studying market direction.
MACD Histogram: MACD (Moving Averages Convergence / Divergence) lost strength on Wednesday and ended the day with an unconfirmed down signal. The histogram turned negative.
- Settings: For MACD Histogram, I am using the Fast Points set at 13, Slow Points at 26 and Smoothing at 9.
Ultimate Oscillator: The Ultimate Oscillator is falling and negative.
- Settings: The Ultimate Oscillator settings are: Period 1 is 5, Period 2 is 10, Period 3 is 15, Factor 1 is 4, Factor 2 is 2 and Factor 3 is 1. These are not the default settings but are the settings I use with the S&P 500 chart set for 1 to 3 months.
Slow Stochastic: The Slow Stochastic has a down signal in place and is no longer overbought.
- Settings: For the Slow Stochastic I use the K period of 14 and D period of 3. The Slow Stochastic tries to predict the market direction further out than just one day.
Relative Strength Index: The RSI signal is falling and negative. It is nearing oversold which often means a bounce should be expected shortly.
- Settings: The relative strength index is set for a period of 5 which gives it 5 days of market movement to monitor. It is often the first indicator to show an overbought or oversold signal.
Rate of Change: The rate of change signal is rising while the rest of the signals are falling. This usually signals a bounce is coming.
- Settings: Rate Of Change is set for a 21 period. This indicator looks back 21 days and compares price action from the past to the present. With the Rate Of Change, prices are rising when signals are positive. Conversely, prices are falling when signals are negative. As an advance rises the Rate Of Change signal should also rise higher, otherwise the rally is suspect. A decline should see the Rate Of Change fall into negative signals. The more negative the signals the stronger the decline.
Support and Resistance Levels To Be Aware Of:
4250 is resistance
4240 is resistance
4225 is resistance
4210 is resistance
4200 is resistance
4190 is resistance
4180 is resistance
4175 is resistance
4150 is resistance
4135 is resistance
4125 is support
4100 is support
4090 is support
4075 is support
4050 is support
4030 is light support
4025 is light support
4000 is support
Stock Market Outlook for Thu May 25 2023
For Thursday the technical indicators are turning negative but there are signals that a bounce should be expected as early as Thursday.
Potential Economic and Political Market Moving Events
On Thursday we could see some movement based on the three reports below.
Thursday:
8:30 GDP (second reading)
8:30 Weekly Initial Unemployment Insurance Claims which are expected to come in at 245,000
10:00 Pending home sales.