

Prior Trading Day Summary
On Thu Oct 29 2026 stocks ended the day lower as fallout from the plunge in Alphabet Stock (GOOGL), Fortinet Stock (FTNT) and others lead to an expansion in the selling. Alphabet Stock (GOOGL) had its worse day in its history as did ServiceNow Stock (NOW). After hours on Thursday Amazon.com reported an earnings misswhich dragged the stock lower in late day trading. This setup the SPX for a down day on Friday to end the week on a negative note.
The SPX fell 23 points to close at 7720. Volume was 5.9 billion with 69% of all trades still rising by the close.
The NASDAQ fell 365 points to close at 26184 on 7.8 billion shares. New lows pulled back to 229. Up volume was 50% of all shares traded and 50% of all stocks were rising. The NASDAQ will see a higher loss on Friday.
Let’s review the closing technical indicators from Thu Oct 29 2026 to see what they predict for Fri Oct 30 2026.
Stock Market Outlook: SPX Closing Chart For Thu Oct 29 2026
The index ended the day below the Upper Bollinger Band and the 21 day moving average but at the 50 day moving average. This is bearish.
The closing candlestick is bearish for Friday..
The 21 day moving average is rising and closed at 7733. This is bullish.
The 50 day moving average is unchanged and closed at 7698. This is bearish.
The 100 day moving average is rising and closed at 7584. This is bullish.
The 200 day moving average is rising and closed at 7338. This is bullish.
The Lower Bollinger Band is below the 21 and at the 50 day moving average which is negative for stocks. The Upper Bollinger Band is sideways which is neutral.
The SPX chart is more bearish than bullish for Friday.
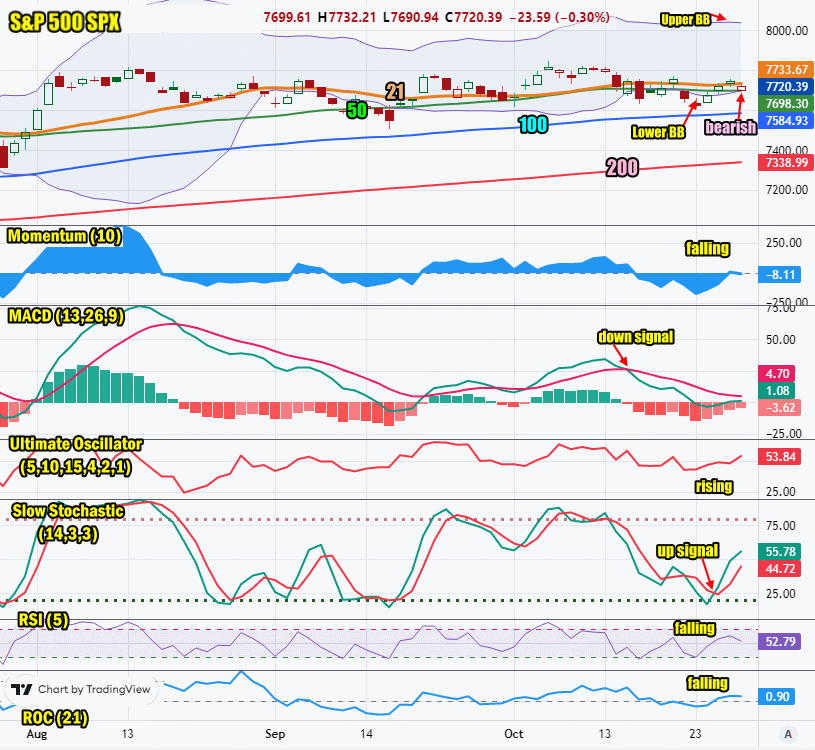
SPX Stock Market Outlook review of Thu Oct 29 2026
Stock Market Outlook: Technical Indicators Review
Momentum: Momentum is falling and negative. This is bearish.
|
MACD Histogram: MACD (Moving Averages Convergence / Divergence) issued a down signal on Thu Oct 15 2026. The down signal was weaker on Thu Oct 29 2026. The chance of an up signal today though is low as the outlook is bearish.
|
Ultimate Oscillator: The Ultimate Oscillator is rising which is bullish.
|
Slow Stochastic: The Slow Stochastic has an up signal in place which is bullish.
|
Relative Strength Index: The RSI signal is falling which is bearish.
|
| Rate of Change: The rate of change is falling signaling that Friday will end lower.
Settings: Rate Of Change is set for a 21 period. This indicator looks back 21 days and compares price action from the past to the present. With the Rate Of Change, prices are rising when signals are positive. Conversely, prices are falling when signals are negative. As an advance rises, the Rate Of Change signal should also rise higher, otherwise the rally is suspect. A decline should see the Rate Of Change fall into negative signals. The more negative the signals the stronger the decline. |
Stock Market Outlook: Support and Resistance Levels |
| 7850 is resistance |
| 7825 is resistance |
| 7800 is resistance |
| 7780 is resistance |
| 7750 is resistance |
| 7700 is resistance |
| 7650 is resistance |
| 7600 is support |
| 7570 is support |
| 7550 is support |
| 7500 is support |
Stock Market Outlook for Fri Oct 30 2026
Earnings on Thursday after the close were disappointing from a number of companies including Alphabet Stock (GOOGL) and ServiceNow Stock (NOW) which had their worse days in their respective history. After hours on Thursday more disappointing earnings arrived from Amazon.com Stock (AMZN), Intel Stock (INTC), Reddit Stock (RDDT), Pinterest Stock (PINS) and more. This will weigh heavily on stocks on Friday and indeed the futures early morning on Friday were strongly negative especially on the NASDAQ.
Expect a choppy day with a negative close. Tech stocks in particular are heading lower today.
Potential Economic and Political Market Moving Events
Monday:
No events
Tuesday:
8:30 Durable Goods for Sep were higher than estimated, coming in at 1.8%
10:00 New home sales for Sep were stronger than expected coming in at 676,000 versus 653,000 estimated. The number though was below the 684,000 new homes for August.
Wednesday:
8:30 Advance U.S. Trade Balance in Goods for Sep was lower than estimated at -$134.9 billion
8:30 Wholesale Inventories for Sep were lower than estimated coming in at 0.6%
2:00 Fed Decision on interest rates
2:30 Fed news conference
Thursday:
8:30 Advance estimate GDP was higher than estimated coming in at 3.4% for the third quarter.
8:30 Weekly Initial Unemployment Insurance Claims for Oct 24 were lower than estimated at 194,000
8:30 Consumer spending month over month for Sep was slightly lower than estimated coming in at 0.5%
8:30 Personal Income month over month came in at 0.2%
8:30 PCE Sep Price index year-over-year came in lower thane estimated at 3.6%
8:30 PCE Sep Price index month over month came in higher at 0.5%
8:30 PCE Sep Core Price Index month over month came in as estimated at 0.3%
8:30 PCE Sep Core Price Index year-over-year came in as estimated at 3.1% Friday:
Friday:
8:30 Employment cost index for third quarter is estimated unchanged at 0.8%