FullyInformed.com
Generic filters
Exact matches only
Search in title
Search in content
Search in excerpt

Stock Market Outlook for Mon Nov 27 2023 – Overbought – Dips Likely But Bullish

Nov 27, 2023 | Stock Market Outlook

Overbought But BullishPrior Trading Day Summary:

The half day of trading on Friday saw low volume but a bullish bias.

The SPX rose slightly up 2 points to end the day at 4559 while the NASDAQ dip 15 points, closing at 14250.

Let’s review the closing technical indicators from Fri Nov 24 2023 to see what to expect for Mon Nov 27 2023, the first day back from the long Thanksgiving holiday.


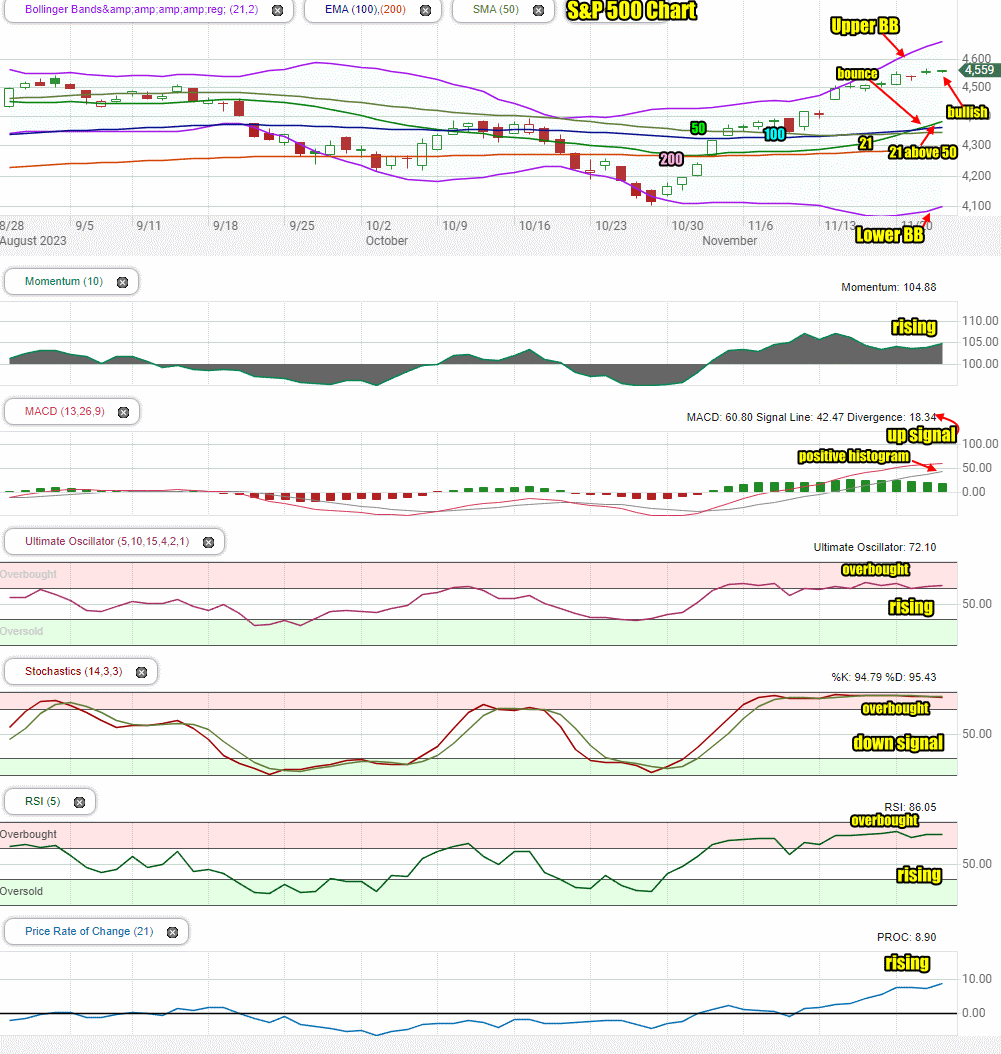
Stock Market Outlook: SPX Closing Chart For Fri Nov 24 2023

The index closed above all major moving averages and continued to move away from the Upper Bollinger Band and sideways. The outlook is still bullish.

The closing candlestick signals another day of dips should be expected on Monday but a bullish bias remains.

The 21 day moving average moved above the 50 day on Friday. This wiped out the first and last remaining down signal from back in August. There are now no down signals.

The 50 day moving average is continuing to climb above the 100 day.

The 100 and 200 day moving averages are climbing which is bullish.

The Lower Bollinger Band is turning up which at present is bullish. The Upper Bollinger Band is continuing higher which is also bullish.

The S&P chart is bullish and is signaling overbought to start the final week of November.

Stock Market Outlook review of Fri Nov 24 2023


Stock Market Outlook: Technical Indicators Review

Momentum: Momentum is rising and positive.

  • Settings: For momentum I use a 10 period when studying market direction.
MACD Histogram: MACD (Moving Averages Convergence / Divergence) issued an up signal on Thu Nov 2. On Fri Nov 24 2023 the close saw some weakness in the up signal for the second straight day.

  • Settings: For MACD Histogram, I am using the Fast Points set at 13, Slow Points at 26 and Smoothing at 9. 
Ultimate Oscillator: The Ultimate Oscillator is rising and positive. It is still overbought.

  • Settings: The Ultimate Oscillator settings are: Period 1 is 5, Period 2 is 10, Period 3 is 15, Factor 1 is 4, Factor 2 is 2 and Factor 3 is 1. These are not the default settings but are the settings I use with the S&P 500 chart set for 1 to 3 months.
Slow Stochastic: The Slow Stochastic has a down signal in place for a second straight day and is very overbought.

  • Settings: For the Slow Stochastic I use the K period of 14 and D period of 3. The Slow Stochastic tries to predict the market direction further out than just one day.
Relative Strength Index: The RSI signal is rising and positive. It is signaling very overbought.

  • Settings: The relative strength index is set for a period of 5 which gives it 5 days of market movement to monitor.  It is often the first indicator to show an overbought or oversold signal.
Rate of Change: The rate of change signal is rising and positive. It is signaling Monday will see choppiness but a larger move, either up or down.

  • Settings: Rate Of Change is set for a 21 period. This indicator looks back 21 days and compares price action from the past to the present. With the Rate Of Change, prices are rising when signals are positive. Conversely, prices are falling when signals are negative. As an advance rises, the Rate Of Change signal should also rise higher, otherwise the rally is suspect. A decline should see the Rate Of Change fall into negative signals. The more negative the signals the stronger the decline.

Stock Market Outlook: Support and Resistance Levels

4600 is resistance
4590 is resistance
4575 is resistance
4565 is resistance
4550 is resistance
4535 is resistance
4520 is resistance
4500 is resistance
4490 is resistance
4475 is support
4450 is support
4440 is support
4425 is support
4400 is support
4375 is support
4350 is support
4325 is support
4300 is support
4275 is light support
4250 is light support
4235 is light support
4225 is support
4200 is good support
4185 is support
4175 is support
4150 is good support


Stock Market Outlook for Mon Nov 27 2023 

For the start of the final week of November there are still signs that the bulls will move stocks higher but there are further warnings signs. The Lower Bollinger Band is rising which at present is bullish but if the Upper Bollinger Band starts to turn sideways and then lower, we need to watch the Moving Average Convergence / Divergence (MACD) indicator. If it falls in strength then there is a good chance for a dip in the rally perhaps as much as 3% to 5% to occur over the next week or two. Meanwhile for Monday the technical indicators are showing a higher close is still expected  which means dips are opportunities to place further trades.


Potential Economic and Political Market Moving Events

Major economic events this week are consumer confidence on Tuesday, the Fed Beige Book on Wednesday afternoon and consumer spending (PCE) on Thursday.

Monday:

10:00 New Home Sales are expected to fall to 725,000 from 759,000


Recent Outlooks

Stock Market Outlook For Thu May 7 2026 – Bullish and Still Higher

Prior Trading Day Summary On Wednesday stocks soared as strong earnings from Advanced Micro Devices Stock (AMD) sparked another rally. The SPX made another new intraday high as it reached 7369. The index closed up 106 points to end the …

Morning Investing Strategy Notes for Wed May 6 2026

For FullyInformed Members the morning Investing Strategy Notes for Wed May 6 2026 look at the rebound on Tuesday following Monday’s selling.. There are a large number of equities discussed in today’s morning Investing Strategy Notes. They include Palantir Tech …

Stock Market Outlook For Wed May 6 2026 – Choppy But Higher Still

Prior Trading Day Summary On Tuesday stocks again shook off Middle East worries and climbed higher. The SPX made another new intraday high as it reached 7273. The index closed up 58 points to end the day at 7259 on …

Morning Investing Strategy Notes for Tue May 5 2026

For FullyInformed Members the morning Investing Strategy Notes for Tue May 5 2026 look at the dip on Monday and the chance for another lower close today. There are a large number of equities discussed in today’s morning Investing Strategy …

Stock Market Outlook For Tue May 5 2026 – Overbought and Lower

Prior Trading Day Summary On Monday stocks saw some minor pressure and ended the day slightly lower. The SPX lost 29 points to close at 7200 on 5.2 billion shares traded. 63% of all stocks were falling by the close …

Morning Investing Strategy Notes for Mon May 4 2026

For FullyInformed Members the morning Investing Strategy Notes for Mon May 4 2026 look at the chance for a lower close. There are a large number of equities discussed in today’s morning Investing Strategy Notes. They include Palantir Tech Stock …

Stock Market Outlook For Mon May 4 2026 – Dips Likely With Possible Lower Close

Prior Trading Day Summary On Friday stocks continued to push higher on the back of better than estimated earnings from a number of large cap companies. With their stocks continuing to climb, stocks are once more extremely overbought. The SPX …

Morning Investing Strategy Notes for Fri May 1 2026

For FullyInformed Members the morning Investing Strategy Notes for Fri May 1 2026 look at the chance for another closing new high on Friday. There are a large number of equities discussed in today’s morning Investing Strategy Notes. They include …

Stock Market Outlook For Fri May 1 2026 – Overbought But Higher

Prior Trading Day Summary On Thursday earnings from a number of big cap stocks like Alphabet Stock (GOOGL) and Eli Lilly Stock (LLY) helped to push the indexes to new all-time highs yet again. The SPX rose 73 points to …

Morning Investing Strategy Notes for Thu Apr 30 2026

For FullyInformed Members the morning Investing Strategy Notes for Thu Apr 30 2026 look at the odds of a lower day. There are a large number of equities discussed in today’s morning Investing Strategy Notes. They include Alphabet Stock (GOOGL), …

Stock Market Outlook For Thu Apr 30 2026 – Dips Likely Possible Lower Close

Prior Trading Day Summary On Wednesday the SPX closed slightly lower while the NASDAQ closed higher ending the day with a mixed outlook. The SPX fell 3 points to close at 7135 on 5.2 billion shares traded. Just 37% of …

Morning Investing Strategy Notes for Wed Apr 29 2026

For FullyInformed Members the morning Investing Strategy Notes for Wed Apr 29 2026 look at expectations for profits on Wednesday and especially Thursday. There are a large number of equities discussed in today’s morning Investing Strategy Notes. They include Nucor …

Stock Market Outlook For Wed Apr 29 2026 – Choppy But Higher Ahead Of More Earnings

Prior Trading Day Summary On Tuesday both the SPX and NASDAQ lost a little ground but the bigger earnings are set to be released starting tomorrow. The SPX fell 35 points to close at 7178 on 5 billion shares traded …

Morning Investing Strategy Notes for Tue Apr 28 2026

For FullyInformed Members the morning Investing Strategy Notes for Tue Apr 28 2026 look at anticipated market action for today. There are a number of equities discussed in today’s morning Investing Strategy Notes. They include Intel Stock (INTC), Nucor Stock …

Subscribe For The Latest News