
Prior Trading Day Summary
On Thu Sep 17 2026 stocks sold lower as the Fed Chair announced a quarter point rate hike. The hike was more symbolic as on its own it won’t do much to curb inflation and will do nothing to lower oil prices. It was though an event that markets had anticipated and with the rate hike out-of-the-way, stocks are sitting oversold after Wednesday’s drop. The SPX came down to 7507 before recovering to close at 7551 which signals that a bounce is already in the works.
The SPX fell 34 points to close at 7551 marking a third straight decline of modest declines. Volume picked up slightly by 100 million shares to 5.4 billion traded with 70% of all volume moving lower which is an increase from yesterday’s 63%. New lows however were just 204, up from Tuesday’s 374 and Monday’s 265, the lowest so far this week and another signal of an impending bounce. By the close 58% of all stocks were falling on the SPX the same percentage as Monday.
The NASDAQ lost just 3 points to close at 25,978, another signal of an impending bounce. Trading volume rose by 2.2 billion to 10.5 billion, the best volume since August 3 with the NASDAQ bounced 540 points and closed at 25,913 points. This is just 65 points lower, another signal of an impending bounce.
By the close 57% of volume was being traded higher. The increase in trading volume shows many investors were buying the dip on Wednesday and placing capital back into the markets after the Fed’s interest rate announcement. New lows were still high at 395 but still below both Monday and Tuesday’s new 52 week lows.
All the signals from the SPX chart also point to a higher close for Thursday.
Let’s review the SPX closing technical indicators from Wed Sep 16 2026 to see what they predict for Thu Sep 17 2026.
Prior Trading Day Earned Income
On Wed Sep 16 2026 there were 7 trades with a total income earned of $3084.
This brings the total income earned this week to $13,493.
Trades were done in a number of stocks including banking stocks, Bank Of America Stock (BAC) and Wells Fargo Stock (WFC) as financials were weak after the Fed’s interest rate hike. I took advantage of the dips to place trades. Another interesting trade was done in Procter and Gamble Stock (PG). Members can review all of Wednesday’s trades through this list. Reviewing prior trades can be helpful and profitable as prices change constantly and prices often improve in the day’s following trades being entered.
Thank You! – End of Summer Membership Sale
Wednesday was the final day of the End of Summer Sale. Welcome to new members who have joined for the first time. Thank you to existing members who renewed their memberships to take advantage of the End of Summer Sale. I appreciate the support you have provided for FullyInformed.com to continue providing information, data feeds and updates to trades and ideas.
Stock Market Outlook: SPX Closing Chart For Wed Sep 16 2026
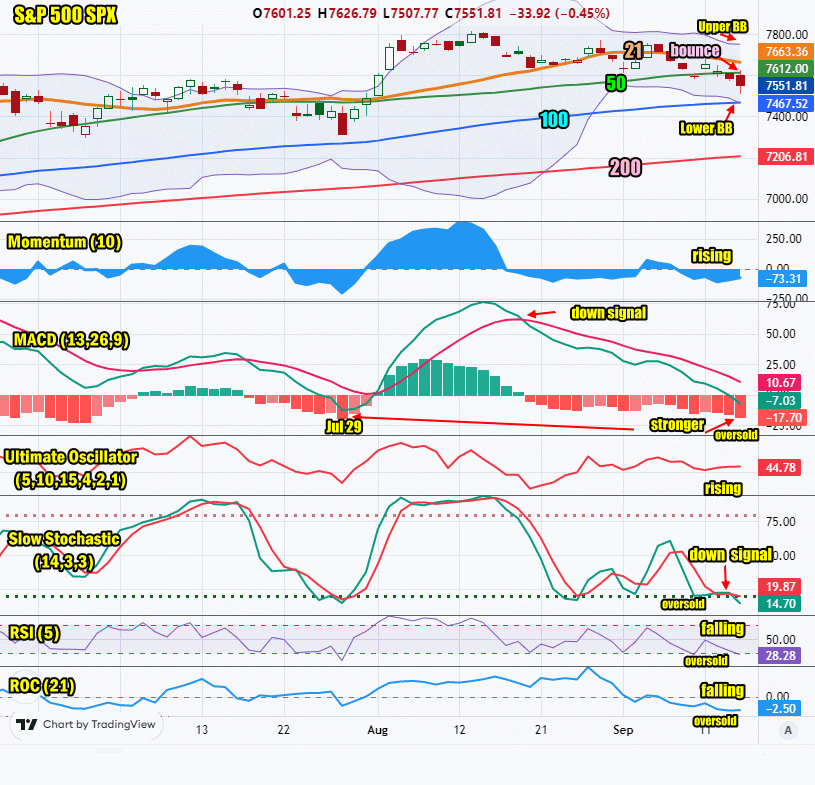
The index ended the day below the Upper Bollinger Band, the 21 day and 50 day moving average which is bearish. It also fell to major support at the 7500 level which is above the 100 day moving average.
The closing candlestick signals stocks are oversold and a large bounce is likely.
The 21 day moving average is falling and closed at 7663. This is bearish.
The 50 day moving average is rising and closed at 7612. This is bullish.
The 100 day moving average is rising and closed at 7467. This is bullish.
The 200 day moving average is rising and closed at 7206. This is bullish.
The Lower Bollinger Band is fell to just belowthe 100 day. It is falling lower and while bearish, normally this action below the 100 day is bullish for a bounce. The Upper Bollinger Band is falling but turning sideways. This is still bearish but points to the likelihood that stocks will move higher in a bounce.
The SPX chart is more bearish than bullish for Thu Sep 17 2026 but points strongly to a bounce as being likely.
SPX Stock Market Outlook review of Wed Sep 16 2026
Stock Market Outlook: Technical Indicators Review
Momentum: Momentum is rising but negative. It is bearish but points to a potential bounce.
|
MACD Histogram: MACD (Moving Averages Convergence / Divergence) issued a down signal on Thu Aug 20 2026. On Wed Sep 16 2026 the down signal gained strength but if at levels signaling a bounce is likely. If you look at the chart you can see the most recent bounce was off a similar signal on July 29.
|
Ultimate Oscillator: The Ultimate Oscillator is rising and while still bearish it is pointing to a higher reading for Thursday.
|
Slow Stochastic: The Slow Stochastic has a down signal in place and is very oversold. A bounce is likely.
|
Relative Strength Index: The RSI signal is falling and into oversold readings. A bounce is likely.
|
| Rate of Change: The rate of change is falling and oversold, signaling that Thursday will end higher. Settings: Rate Of Change is set for a 21 period. This indicator looks back 21 days and compares price action from the past to the present. With the Rate Of Change, prices are rising when signals are positive. Conversely, prices are falling when signals are negative. As an advance rises, the Rate Of Change signal should also rise higher, otherwise the rally is suspect. A decline should see the Rate Of Change fall into negative signals. The more negative the signals the stronger the decline. |
Stock Market Outlook: Support and Resistance Levels |
| 7800 is resistance |
| 7780 is resistance |
| 7750 is resistance |
| 7700 is resistance |
| 7650 is resistance |
| 7600 is resistance |
| 7590 is resistance |
| 7570 is resistance |
| 7550 is resistance |
| 7500 is support |
| 7450 is support |
| 7425 is support |
| 7400 is support |
Stock Market Outlook for Thu Sep 17 2026
With the Fed rate hike out-of-the-way, the SPX tested the 7500 level, which as you may recall was mentioned a number of times in the stock market outlook daily as the prime support to watch. With the index slipping to within 7 points and then finding a flood of buyers, the signal is for a bounce on Thursday. Despite oil prices, higher inflation and the rate hike, stocks have remained resilient and all signals on Wednesday at the close pointed to a large bounce for Thursday. A retest of 7500 is possible next week but if should hold a second time. Stocks should move higher on Thursday, could be flat on Friday, dip early next week and then continue to move higher as next week progresses. I do not expect a market plunge in September despite many analysts predicting one. September has a weird history of plunges and strong rallies. This year I think it will end higher than it started.
For Thursday watch for a bounce, take some profits to trim positions where possible and get capital ready for further trades. I expect tech names that have been once more beaten down will rally away from the AI doomsday scenario at least for now. Thursday will end higher.
Potential Economic and Political Market Moving Events
Monday:
No reports
Tuesday:
8:30 Empire State Manufacturing Survey fell to 7.6, much lower than estimated and well below the 20.6 prior
Wednesday:
8:30 Retail Sales for Aug were much stronger coming in at 1.2% beating the prior reading of -0.6%
8:30 Import Prices for Augrose far more than estimated to 0.7%
10:00 NAHB Housing Market Index for Sep was lower than estimated at 32
2:00 Fed interest rate increased by a quarter point
2:30 Fed news conference sent stocks lower
Thursday:
8:30 Housing starts for Aug are expected to rise to 1.3 million from 1.2 million prior
8:30 Weekly Initial Unemployment Insurance Claims for Sep 12 are estimated to rise to 207,000 from 206,000 prior
10:00 Pending home sales for August are expected to rise to 0.5% from -2.3% prior which is a big jump