

Prior Trading Day Summary
On Tue Sep 15 2026 stocks stayed weak as oil rose and bond yields continued to climb. Investor angst over what most analysts believe will be a hike in interest rates kept stocks depressed while worries about AI being an existential threat to humanity still weighed heavily on investors. Considering everything being thrown at the markets so far in just the two past days, stocks are actually holding up quite well.
The SPX fell 34 points to close at 7585 which is where the index was on Sep 10. Volume picked up slightly by 200 million shares to 5.3 billion traded with 63% of all volume moving lower which is an increase from yesterday’s 56%. A bit more concerning was a jump in new 52 week lows to 374 from yesterday’s 265 stocks. By the close 65% of al stocks were falling on the SPX.
The NASDAQ lost 204 points to close at 25,981. Trading volume rose by 800 million shares to 8.3 billion with 64% of volume moving lower and 68% of all stocks falling. There were 419 new 52 week lows on Tuesday which remains almost on par with Sep 10th 422 new lows. The only other day when there were this many lows was in March.
Even though the day will revolve around the Fed’s interest rate announcement in the afternoon today, the technical indicators are well worth visiting as they look out beyond just today.
Let’s review the SPX closing technical indicators from Tue Sep 15 2026 to see what they predict for Wed Sep 16 2026.
Prior Trading Day Earned Income
On Tue Sep 15 2026 there were 10 trades with a total income earned of $4542.
Trades were done in the Retiring Easy Portfolio and in the Million Dollar Challenge Portfolio. Today could see better prices and I may add to those trades depending on what income can be earned. Another trade that was setup was in the SPY ETF ahead of the Fed Announcement. This trade’s profit is not yet known but the goal is for a 100% return. Members can review all of Tuesday’s trades through this list.
Final Day Of End of Summer Membership Sale
Today is the final day of the End Of Summer Membership Sale. This sale provided a $200 discount on a 12 month membership. This large a discount will not be offered again this year including at the Black Friday Sale. I hope investors both new to FullyInformed.com and those renewing memberships take advantage of the deep discount.
Stock Market Outlook: SPX Closing Chart For Tue Sep 15 2026
The index ended the day below the Upper Bollinger Band, the 21 day and 50 day moving average which is bearish.
The closing candlestick signals that the outlook is bearish but also stocks are oversold and probably ready to bounce.
The 21 day moving average is falling and closed at 7672. This is bearish.
The 50 day moving average is rising and closed at 7611. This is bullish.
The 100 day moving average is rising and closed at 7465. This is bullish.
The 200 day moving average is rising and closed at 7202. This is bullish.
The Lower Bollinger Band is above the 100 day and below the 50 day moving average. It is falling lower. This is bearish. The Upper Bollinger Band is falling which is bearish. Signals are advising stocks are in a Bollinger Bands Squeeze that may be ending with stocks set to fall lower.
The SPX chart is more bearish than bullish for Wed Sep 16 2026.
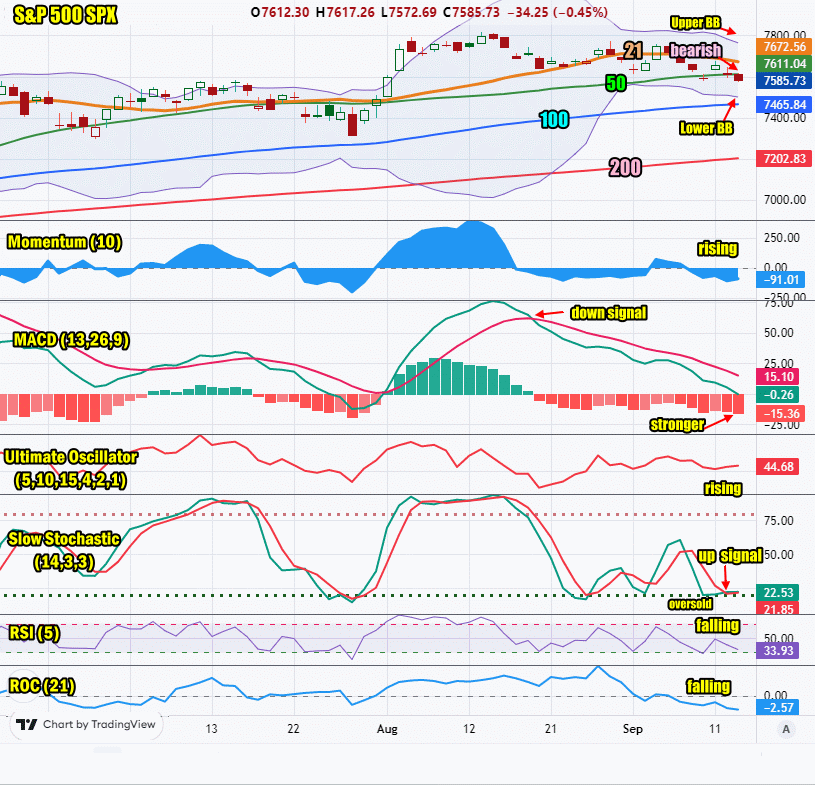
SPX Stock Market Outlook review of Tue Sep 15 2026
Stock Market Outlook: Technical Indicators Review
Momentum: Momentum is rising but negative. It is bearish.
|
MACD Histogram: MACD (Moving Averages Convergence / Divergence) issued a down signal on Thu Aug 20 2026. On Tue Sep 15 2026 the down signal gained strength.
|
Ultimate Oscillator: The Ultimate Oscillator is rising but bearish.
|
Slow Stochastic: The Slow Stochastic has an up signal in place from being oversold.
|
Relative Strength Index: The RSI signal is falling which is bearish.
|
| Rate of Change: The rate of change is falling and signaling that Wednesday will end lower. Settings: Rate Of Change is set for a 21 period. This indicator looks back 21 days and compares price action from the past to the present. With the Rate Of Change, prices are rising when signals are positive. Conversely, prices are falling when signals are negative. As an advance rises, the Rate Of Change signal should also rise higher, otherwise the rally is suspect. A decline should see the Rate Of Change fall into negative signals. The more negative the signals the stronger the decline. |
Stock Market Outlook: Support and Resistance Levels |
| 7800 is resistance |
| 7780 is resistance |
| 7750 is resistance |
| 7700 is resistance |
| 7650 is resistance |
| 7600 is resistance |
| 7590 is resistance |
| 7570 is resistance |
| 7550 is resistance |
| 7500 is support |
| 7450 is support |
| 7425 is support |
| 7400 is support |
Stock Market Outlook for Wed Sep 16 2026
Market Direction for Wed Sep 16 2026 will be all about the Fed’s announcement on interest rates. Over 90% of analysts are of the opinion the Fed will hike rates a quarter point. A quarter point is more a symbolic gesture and will not fight inflation caused by rising oil prices but it does signal that the Fed is willing to act and that may be enough for stocks for now. The likelihood of a rally after a quarter point increase is high especially with stocks oversold. Meanwhile if the Fed does nothing stocks could sell lower but then rally on Thursday. The President has made it clear that he wants interest rates lower and that could influence some of the decision-making. My own outlook is that a quarter point hike will be felt more in housing and mortgages but it will not change the outlook for inflation. I did not expect a rate increase until after the mid-term elections. I am of the same opinion but with 90% of analysts on the other side of the interest rate fence I am pretty lonely on my side. Whatever the Fed does as long as it nothing dramatic like a half point rate hike, stocks should move higher shortly.
On Tuesday the Empire State Manufacturing Survey disappointed with a plunge to a reading of 7.6, down from 20.6 prior and well below estimates of 15. This is bearish.
Potential Economic and Political Market Moving Events
Monday:
No reports
Tuesday:
8:30 Empire State Manufacturing Survey fell to 7.6, much lower than estimated and well below the 20.6 prior
Wednesday:
8:30 Retail Sales for Aug are estimated at 0.8% up from -0.6% prior
8:30 Import Prices for Aug are estimated at 0.4% up from -0.4% prior
10:00 NAHB Housing Market Index for Sep is estimated to fall slightly to 34 from 35
2:00 Fed interest rate decision announced
2:30 Fed news conference