

Prior Trading Day Summary
On Tue Oct 27 2026 stocks continued with their rebound rally. The SPX closed at the 21 day moving average despite 700 million less shares being traded.
The SPX rose 45 points to close at 7722. Volume was 5.2 billion and while 64% of that volume was being traded lower by the close, 57% of all stocks were rising. Perhaps more important, there were just 102 new 52 week lows. All of this is bullish.
The NASDAQ rose 308 points to close at 26477 on 8.2 billion shares which was up 500 million shares from Monday. New lows pulled back to 288. Up volume was 68% of all shares traded and 63% of all stocks were rising. These are bullish stats. The index has added 522 points over the past two days.
Tuesday’s numbers were much stronger for the bulls. Let’s review the closing technical indicators from Tue Oct 27 2026 to see what they predict for Wed Oct 28 2026.
Stock Market Outlook: SPX Closing Chart For Tue Oct 27 2026
The index ended the day below the Upper Bollinger Band but at the 21 day moving average. This is bullish.
The closing candlestick is bullish but there is a top shadow which often signals that the rally might run into some sellers today and end lower.
The 21 day moving average is rising and closed at 7726. This is bullish.
The 50 day moving average is unchanged and closed at 7697. This is bearish.
The 100 day moving average is rising and closed at 7578. This is bullish.
The 200 day moving average is rising and closed at 7331. This is bullish.
The Lower Bollinger Band is below the 21 and 50 day moving average and falling. This is bullish for stocks. The Upper Bollinger Band is sideways which is neutral.
The SPX chart is equally bullish and bearish for Wednesday. The biggest concern is the closing candlestick and the warning from the top shadow.
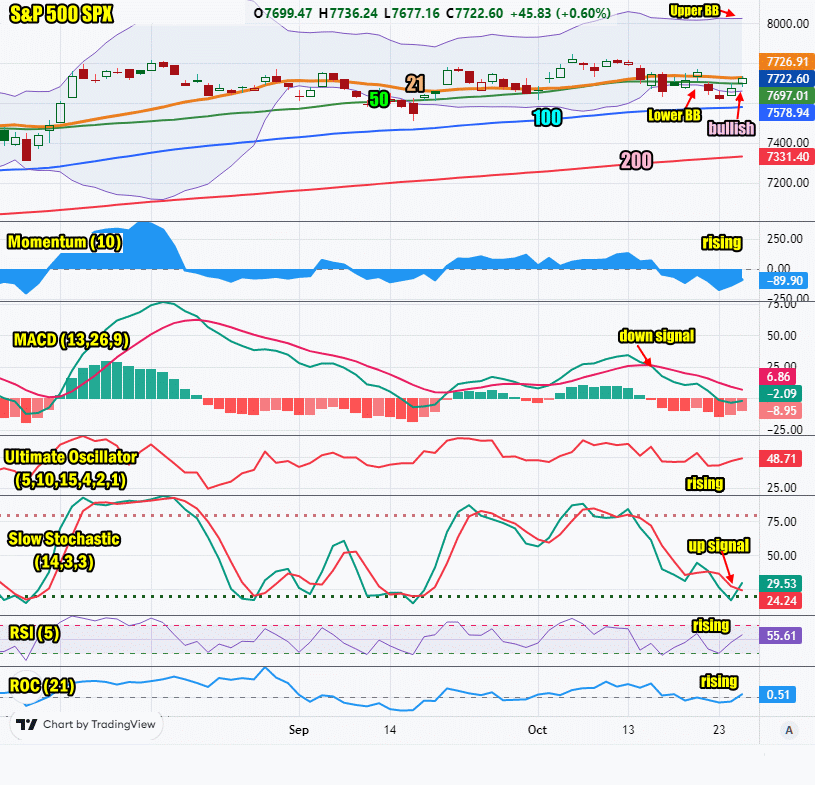
SPX Stock Market Outlook review of Tue Oct 27 2026
Stock Market Outlook: Technical Indicators Review
Momentum: Momentum is rising and negative. This is bearish.
|
MACD Histogram: MACD (Moving Averages Convergence / Divergence) issued a down signal on Thu Oct 15 2026. The down signal was weaker on Tue Oct 27 2026.
|
Ultimate Oscillator: The Ultimate Oscillator is rising which is bullish.
|
Slow Stochastic: The Slow Stochastic has an up signal in place which is bullish.
|
Relative Strength Index: The RSI signal is rising which is bullish.
|
| Rate of Change: The rate of change is rising signaling that Wednesday will end higher.
Settings: Rate Of Change is set for a 21 period. This indicator looks back 21 days and compares price action from the past to the present. With the Rate Of Change, prices are rising when signals are positive. Conversely, prices are falling when signals are negative. As an advance rises, the Rate Of Change signal should also rise higher, otherwise the rally is suspect. A decline should see the Rate Of Change fall into negative signals. The more negative the signals the stronger the decline. |
Stock Market Outlook: Support and Resistance Levels |
| 7850 is resistance |
| 7825 is resistance |
| 7800 is resistance |
| 7780 is resistance |
| 7750 is resistance |
| 7700 is resistance |
| 7650 is resistance |
| 7600 is support |
| 7570 is support |
| 7550 is support |
| 7500 is support |
Stock Market Outlook for Wed Oct 28 2026
Today will be all about the Fed as we get the latest decision on interest rates this afternoon at 2:00 PM. The consensus is the Fed will not raise rates, particularly with the mid-terms just a week away. However there is also speculation that the Fed’s comments will be hawkish. That means a rate hike in November could be likely. I will not be placing a trade today in the Trahe ahead Of The Fed Portfolio as I think the market reaction today and tomorrow will be muted.
We get earnings today from Microsoft, Alphabet, ServiceNow, Fortinet and T-Mobile to mention just a few. These are after hours. With the Fed news at 2:00 and conference a 2:30, stocks are likely to rise ahead of the Fed’s interest rate news and ahead of earnings after the close. The day will end higher.
Potential Economic and Political Market Moving Events
Monday:
No events
Tuesday:
8:30 Durable Goods for Sep were higher than estimated, coming in at 1.8%
10:00 New home sales for Sep were stronger than expected coming in at 676,000 versus 653,000 estimated. The number though was below the 684,000 new homes for August.
Wednesday:
8:30 Advance U.S. Trade Balance in Goods for Sep is estimated at -$132.6 billion
8:30 Wholesale Inventories for Sep is estimated unchanged at 0.7% for Sep
2:00 Fed Decision on interest rates
2:30 Fed news conference