
 Prior Trading Day Summary:
On Thursday the day started well with stocks moving higher but with geopolitical turmoil in the Middle East, rising oil prices, a jump in gold and finally comments from Fed President Neel Kashkari on the possibility of interest rates not coming down amid “sticky” inflation, stocks went into a tailspin mid-afternoon. The selling was not intense but instead it was steady. This is typical of a sell-off as sell programs keep kicking in on the way down which draws in more investors.
By the close the SPX was down 64 points to 5147. This is where the index closed March 11. Volume was 4.1 billion shares with 75% of the volume to the downside by the close. The index closed at the lows of the day.
The NASDAQ fell 228 points to close at 16049 back to where it stook on March 6. Volume was 5.5 billion shares, the highest since March 20 when the index rose 202 points.
With many investors “spooked” by the drop, analysts were split on the outlook with some expecting further declines on Friday and next week and just as many expecting the market to simmer and then recover next week.
Let’s review the closing technical indicators on Thu Apr 4 2024 to see what to expect for Fri Apr 5 2024.
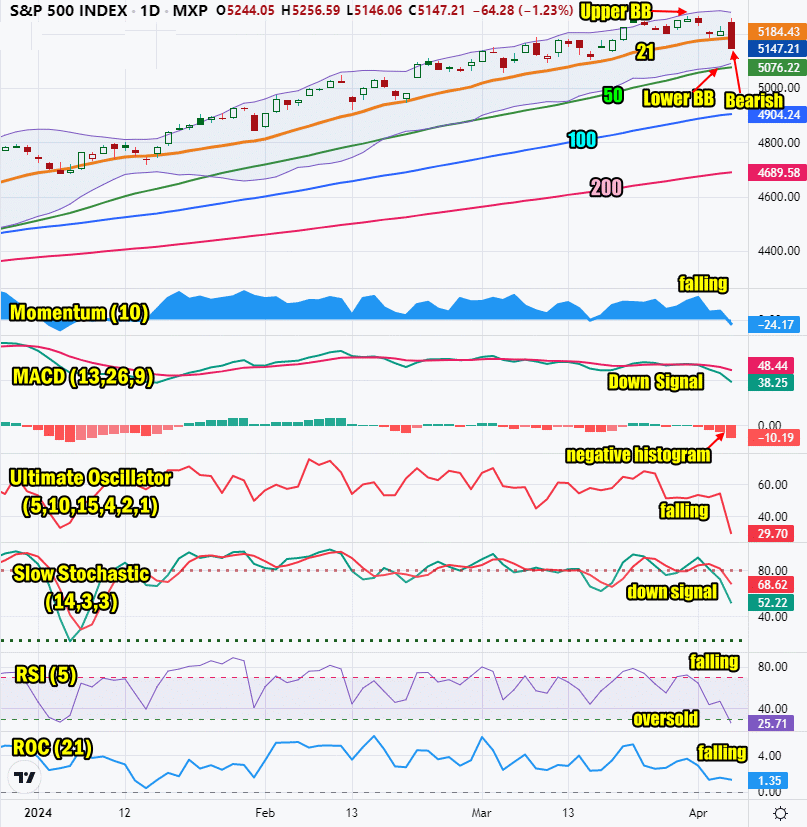
Stock Market Outlook: SPX Closing Chart For Thu Apr 4 2024
The index closed well below the Upper Bollinger Band and below the 21 day moving average. This is bearish.
The closing candlestick is signaling the index is oversold and a bounce is probable but further downside lies ahead.
The 21 day moving average is now turning sideways which is bearish.
The 50 day moving average is rising and at 5076, which is bullish.
The 100 and 200 day moving averages are climbing which is bullish. The 200 day is at 4689 on the SPX which is bullish.
The Bollinger Bands are moving into the start of another Bollinger Bands Squeeze. The Lower Bollinger Band isturning back up which the Upper Bollinger Band is turning lower. A new Bollinger Bands Squeeze is underway and at present the squeeze looks like it will end with stocks moving lower..
The S&P chart is more bearish than bullish for Friday despite the potential for an oversold bounce.
Stock Market Outlook review of Thu Apr 4 2024
Stock Market Outlook: Technical Indicators Review
Momentum: Momentum is falling and negative.
|
MACD Histogram: MACD (Moving Averages Convergence / Divergence) issued a down signal on Tue Apr 2. On Thu Apr 4 2024 the down signal gained strength. The MACD histogram is strongly negative.
|
Ultimate Oscillator: The Ultimate Oscillator is falling sharply and nearing oversold signals.
|
Slow Stochastic: The Slow Stochastic has a down signal in place and is not overbought.
|
Relative Strength Index: The RSI signal is falling sharply and negative. It is very oversold.
|
Rate of Change: The rate of change signal is falling indicating Friday will end lower.
|
Stock Market Outlook: Support and Resistance Levels |
| 5275 is resistance |
| 5250 is resistance |
| 5225 is resistance |
| 5200 is resistance |
| 5190 is resistance |
| 5175 is resistance |
| 5150 is resistance |
| 5125 is resistance |
| 5115 is resistance |
| 5100 is support |
| 5075 is support |
| 5050 is support |
| 5025 is support |
| 5000 is light support |
| 4990 is light support |
| 4975 is light support |
| 4950 is support |
| 4925 is support |
| 4915 is support |
| 4900 is support |
Stock Market Outlook for Fri Apr 5 2024
The technical indicators aare all pointing lower for stocks. The closing candlestick on the S&P points to a good chance for a bounce, but the technical indicators explain that any bounce won’t hold and the market is being setup to move lower.
Caution is advised and investors should guard capital from losses. A further decline after a bounce attempt is likely.
On Friday we get the March non-farm payroll numbers. They are expected to be higher than the estimates. If that is the case stocks will sell lower on Friday.
Potential Economic and Political Market Moving Events
The major event this week is the March non-farm payroll numbers due out on Friday at 8:30.
Monday:
9:45 S&P USA manufacturing PMI is expected to be unchanged at 52.5 but was 51.9
10:00 Consumer spending is expected to rise to 0.7% but fell to -0.3%
10:00 ISM manufacturing is expected to rise to 48.1% from 47.8% prior but rose to 50.3%
Tuesday:
10:00 Factory orders are expected to rise to 1% but rose to 1.4%
10:00 Job openings are expected to slip slightly to 8.8 million from 8.9 million prior. It came in at 8.8 million.
Auto sales are expected at any time during the day.
Wednesday:
8:15 ADP employment is expected at 155,000 but came in at 184,000.
9:45 S&P services PMI was unchanged at 51.7
10:00 ISM services climbed slightly to 52.7%
Thursday:
8:30 Weekly Initial Unemployment Insurance Claims are expected to be 213,000 but came in at 221,000.
8:30 Trade balance is estimated at -$67.7 billion but came in at -68.9 billion, worse than expected.
Friday:
8:30 March non-farm payroll numbers are expected to show 200,000.
8:30 Unemployment rate is expected to decline to 3.8% from 3.9%
8:30 hourly wages year-over-year are anticipated to be 4.1% higher.
3:00 Consumer credit is expected to be $12.0 Billion