
Investors are always looking for the perfect Market Timing System. I have come in contact a number of market timing systems over the years and most have not had a lot of value as far as I could tell. But every once in a while a market timing system emerges that can prove worthwhile for investors. One simple market timing system that has been widely used is based on the VIX Index.
Volatility in stock markets is something every investor will encounter. Many long-term investors ignore the fluctuations in stocks and try not to concern themselves about volatility. But when stock markets crash and volatility is sky-rocketing, you would be surprised at how many long-term investors unload core positions as stocks plunge.
Investors, such as myself, look at the VIX Index as a tool of significant importance that can assist in investing decisions to provide profitable trades. The VIX Index is the CBOE MARKET VOLATILITY INDEX. For some charting programs the VIX historical volatility index is found by typing in the symbol VIX but with a period before the V, like this .VIX
VIX Index – Definition and Basis as a Market Timing System
The VIX is an index on the Chicago Board of Exchange which is measuring and predicting the expected level of volatility in the US Stock Market (primarily the volatility in the S&P 500) for the next 30 days. While many investors think it is reflecting “today’s” volatility, it is actually predicting based on past volatility, what level of volatility to expect over the next 30 days. This is why the tool is handy to have in any investor’s trading arsenal. Before the VIX volatility index was created, investors had to rely on instinct and experience. Now, thanks to the VIX Index there is a clearer indication of expected volatility. Since the VIX Index predicts volatility it can be used as a market timing system. Understanding how to use the VIX index as a market timing system can improve many trading results, increase profits and protect capital from losses.
Many investors consider the VIX Index a “fear indicator”. There is good reason to consider it as such. When the market is in a downtrend, a correction or a period of uncertainty for investors many investors sell stocks. The VIX Index will reflect this selling by rising in value as more and more sellers enter the stock market. Panic is created by sellers literally dumping shares at whatever prices they can get as they elect to vacate the stock markets during severe corrections. This severity of selling or panic is reflected in the VIX Index as its continues to rise in value.
The exact opposite occurs when the market direction is in an uptrend and stock prices are climbing. Volatility declines as does the VIX Index to reflect the rising prices.
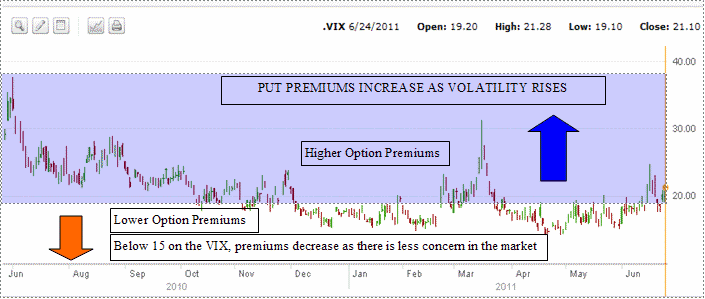
The VIX Index chart below for the period of June 2010 to June 2011 shows 12 months of volatility. I have marked periods of higher volatility and those periods of lower volatility. When the VIX Index is below 15 there is almost complacency among investors that stocks will not fall. Above $20 and selling volume almost always is rising and investors are becoming worried about the direction of stocks.
Volatility Drives Option Prices
As I sell and buy options I know from experience that volatility will drive the price of options. During periods of high volatility, option premiums, particularly put premiums will rise, often dramatically. In periods of low volatility, option premiums decline.
For those investors who buy options, volatility is equally important. If, for example, an investor buys put options to protect his stock holdings, during periods of higher volatility, he will pay more for the puts, then during periods of lower volatility. Therefore if an investor is looking for protection or insurance against a stock market downturn, it is best to consult the VIX Index to time when to purchase put protection. If put protection is bought late in a correction an investor will pay a great deal more for puts than if bought early in a correction.
VIX Index Market Timing System Basics
In its most basic form, the VIX Index as a Market Timing System is used based on values above and below $20.00. There are many investors who believe that any movement of the VIX above $20.00 should be taken as a warning sign that stocks are going to correct further.
VIX Index Market Timing System – Buy Put Protection Above $20.00
Those investors will begin to purchase puts for protection in larger lots as the VIX moves up from $20. In other words as the VIX Index climbs, more and more puts are purchased.
By staggering the put buying based on the VIX Index Market Timing System, should the VIX Index signal be wrong, an investor would not have purchased many puts so the capital loss would be smaller than buying the put protection all in one trade as soon as the VIX Index crossed $20.
Investors almost always purchase a percentage of put options based on the size of their portfolio. For example, an investor who has $50,000.00 in the stock market might consider purchasing a total of 15 SPY PUTS to protect the overall portfolio. Some long-term investors who use the SPY Puts for insurance will buy at least 3 months out in time and at the money. Most will buy 6 months out in time if available.
Let’s take this hypothetical example: (dates, VIX premiums, SPY prices are all fictitious)
April 2 – SPY at 126 – VIX at 20 – 3 SPY PUTS purchased for SEPT at 126.
April 4 – SPY at 125 – VIX at 22 – 3 SPY PUTS purchased for SEPT at 125
April 8 – SPY at 126 – VIX at 24 – 4 SPY PUTS purchased for SEPT at 126
April 10 – SPY at 125 – VIX at 26 – 5 SPY PUTS purchased for SEPT at 125
Total of 15 SPY puts purchased.
SPY puts Options value fluctuates depending on volatility and the time period purchased. Therefore many investors will choose 3 months as a minimum. Most will choose 6 months. By going out in time by at least 3 months, the investor has some time before the puts expire and should the market not fall, puts furthest out in time will hold some value to assist an investor in recovering some of his purchase cost. By going out 6 months rather than 3 months when buying put protection, there will be more value in the put premiums if the stock markets do not fall, allowing the investor to recover more of his Spy Put Options premiums paid.
VIX Index Market Timing System – No Rule On Quantity Of Puts Purchased
The number of puts purchased usually depends on the size of the portfolio. The larger the portfolio, the more put contracts are purchased. There is no set rule or formula. It all depends on the investor’s level of comfort. Some investors do not purchase SPY puts, but instead will purchase PUTS on the individual stocks or ETF’s they are holding. Also, many investors purchase 100% insurance, meaning 1 put contract for every 100 shares of the stock held. Therefore if an investor has 500 shares of Microsoft stock for example, they will purchase 5 put contracts to protect all 500 shares.
Market Timing System Using The VIX Index
If an investor used this simple market timing system and bought protection every time the VIX Index moved above $20.00 how effective has it been?
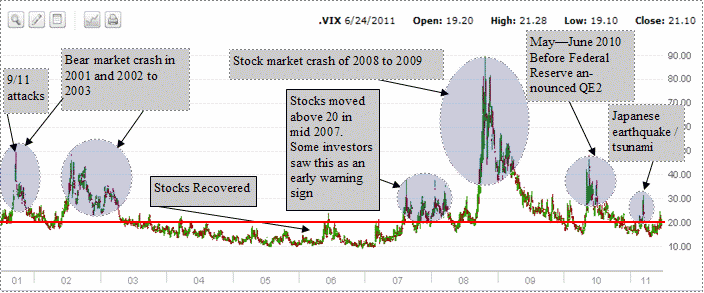
The chart below looks at the period of 2001 to 2011 of the VIX Index.
Based on the belief that anywhere above $20.00 should concern investors and commence the purchasing of puts for protection, the chart below does show some value to this Market Timing System.
VIX Index Market Timing System Did Offer Significant Protection
Those investors who purchased puts were insured against the 9/11 attacks and the Bear Markets of 2001, 2002, 2003 as well as the 2008 to 2009 collapse. They also would have had protection for the May to June 2010 pullback. The Japanese Earthquake-Tsunami was an event that there was no warning for. Investors therefore would not have had protection. Presently investors who follow this strategy would also be commencing to buy put protection now (Dec 29 2012)
When This Market Timing System Is Wrong
Meanwhile during the period when stocks recovered in 2003 through to mid 2007, puts would only have been purchased twice and since they are purchased in small lots to start, and then increased depending on the continual rise in the VIX, an investor would not have lost much capital from 2003 to 2007 when the VIX seemed to indicate the stock market would correct.
In 2007 and early 2008 the VIX Index was continually above $20 which warned investors who were using this Market Timing System that the market direction was going to correct.
VIX Index chart - 10 years as a Market Timing System
VIX Index Market Timing System From 1991 to 2011
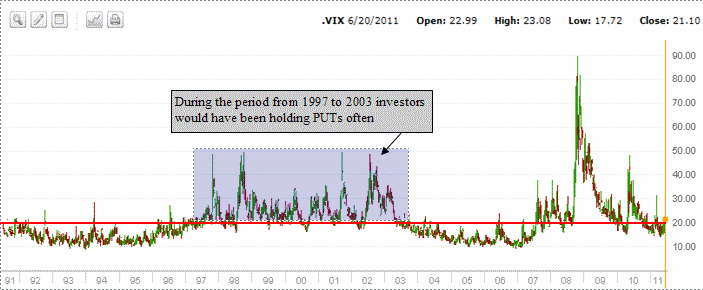
The chart below shows the VIX Index over a 20 year period from 1991 to 2011. This is interesting as it shows that during the period from 1997 to 2003 an investor following this Market Timing System would have bought and sold puts for almost the entire period earning significant profits during that 7 year period.
Note also how the VIX Index was much higher for most of the period than it is today, yet today the number of blogs, news sites and financial articles that are looking for stocks to crash yet again is common place despite the VIX Index not reflecting a high level of concern.
Remember that the VIX Index does not reflect sentiment of investors or fundamentals of stocks. It is predicting future volatility in stocks.
VIX Index chart - 20 years as a Market Timing System
VIX Index Market Timing System And Stop-Loss
Once puts are purchased, investors need to follow their puts and can use a trailing stop-loss strategy to lock in profits should the VIX Index begin to fall back with declining market volatility.
Many investors who purchase puts based on the VIX Index Market Timing System are doing so for insurance and hold them through to expiry as they are seeking protection only and are not concerned about the cost of that protection.
VIX Index Market Timing System and Ultra Bear ETFs
Besides using this Market Timing System to buy put protection, some investors might consider Ultra Bear ETFs. For example the ProShares UltraShort S&P500 ETF whose symbol is SDS might be their choice. The SDS provides double the movement in the S&P 500.
Unfortunately as the charts below show, whereas the VIX Index fluctuates widely with volatility movements, the SDS has a problem with slippage. If held for a longer period of more than just a few weeks, the valuation of the Ultra Bear ETF does not reflect the continued volatility found in stocks as slippage occurs particularly when the market trends sideways. This means Ultra Bear ETFs are not effective in providing the best protection in extended market corrections such as a long bear market.
In the two charts below you can see how SDS is continuing to decline in value despite the jump in volatility and recently it did a 4 to 1 split to try to accommodate the slippage factor. Therefore while the Ultra Bear ETFs can certainly be considered, they should only be held for very short periods of time. If another period should develop like the 1997 to 2003 period when an investor would have held puts for extended periods of time, these ultra bear type ETFs could end up failing to provide adequate protection for investors.

Market Timing System - VIX Index and SDS
VIX Index Market Timing System Summary
The VIX Index as a Market Timing System is worth considering. It is a simple tool to assist in determining when protection is needed and when it can be dropped. By using the VIX Index Market Timing System an investor can scale into protection as market direction drops and through using a stop-loss method, he can lock in profits when the end of a decline occurs.
While no Market Timing System is perfect, there is a lot to like about this extremely simple Market Timing System. My preferences would be to buy Spy Put Options three to six months out in time and to stay away from Ultra Bear ETFs but as you can see from the various charts above, either method of buying protection through the VIX Index Market Timing System holds value for investors.
Internal Market Timing System Links