
FullyInformed.com
Generic filters

Market Timing Shows Market Direction May Hold The 200 Day Moving Average

May 24, 2012 | Stock Market Outlook

Market timing as many readers of fullyinformed.com know is important to my trading strategies. Through market timing I try to predict the market direction so that when I sell puts for do a stock trade, I am on the right side of the market. I do not need market timing to tell me if market direction is going to rush higher, although that would be nice especially for buying SPY Calls. However I do need to know market direction to have confidence when I am placing a trade that the market direction may hold which will increase the odds of the trade being profitable.

To figure out whether there is enough strength in the S&P 500 to allow me to commit additional cash, I used my market timing indicators on the major indexes to determine how strong the market might be at this stage of the correction. I used market timing indicators to read The NASDAQ, The Dow and The S&P 500.

Market Timing For Market Direction

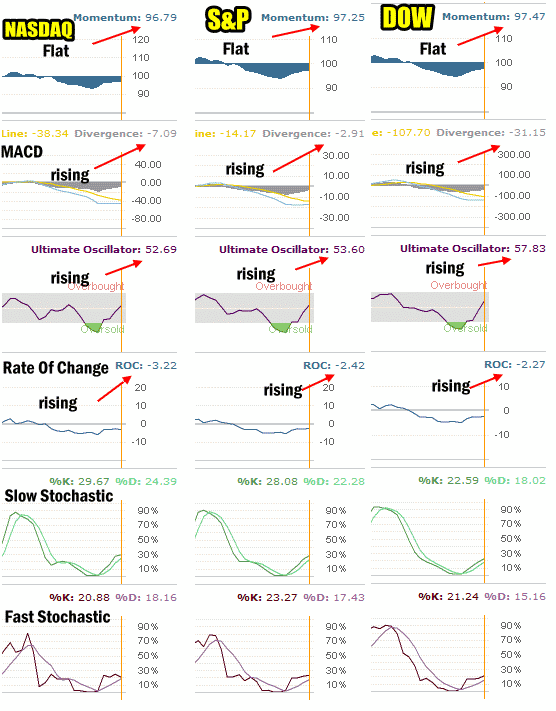
My market timing indicators were quite interesting when I compared the three major indexes. Below you can see the combined chart of The NASDAQ, The S&P 500 and The Dow.

Momentum is flat on all three indexes which would indicate that there remains limited conviction on the part of investors. When the stock markets fall some buying enters but when the market moves up there is little buying.

MACD one of the stronger market timing indicators as it covers both momentum and is an oscillator are showing negative for all 3 indexes but the trend is still rising.

The Ultimate Oscillator is now back above 50.00 on all three indexes which predicts a positive turn in the market or market direction up.

Rate Of Change is still negative on all three indexes but it is climbing.

The last two market timing indicators are quite interesting. Slow Stochastic is predicting that the market direction remains up and as the slow stochastic predicts beyond one or two days, this could be significant.

Fast Stochastic predicts one or two days out and for The NASDAQ it is reasonably flat albeit with a positive bias. For the other two indexes the fast stochastic is indicating that both of these markets should move higher from here.
Market Timing Indicators May 24 2012

Market timing indicators on all 3 indexes for May 24 2012

Market Timing Charts

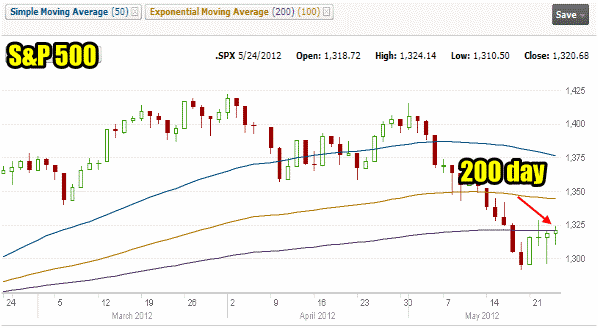
The market timing charts for today on all three indexes are almost identical. All three indices are clinging to the 200 day moving average. Yesterday the candlestick on the S&P 500 was a market up call. Today’s S&P 500 candlestick is a white spinning top. This candlestick shows the indecision among the bulls and bears. The candlestick for today also shows that the market while still at the 200 day, did not close at the high for the day.
Market Timing Chart For S&P 500

The Market Timing Chart For The S&P 500 shows that the index is clinging to the 200 day moving average.

Market Direction Sell Signal On NASDAQ

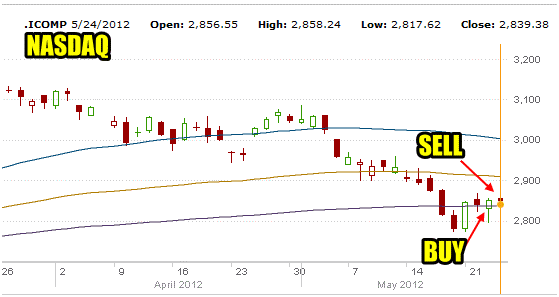
Yesterday the candlestick on the NASDAQ issued a buy signal. Today however the candlestick issued a sell signal. This shows how indecisive the latest rally was. The NASDAQ candlestick today was a black candlestick which represents selling pressure. For much of the day the NASDAQ index was being pressured. This caused the black candlestick and the reason for the candlestick to issue a sell on the NASDAQ.
Market Timing Candlestick Sell Signal On The NASDAQ

Market Timing Candlestick Sell Signal On The NASDAQ

The Dow Index has not issued a buy signal despite the push back to the 200 day moving average and today it did close near the high for the day. But there are many headwinds for these markets to push through to rally back.

Market Timing Outlook For June

As the markets are into their final week of May trading, it is interesting to point out that May has been a poor month for stocks for many years. However June has been a better month and with the elections this year, the market could receive the much-needed elections push to get it back above the 200 day moving average.

My own opinion based on my market timing indicators is that the market direction will try to hold here. If market direction can hold a few days indexes could build enough strength to regain the 100 day moving average and from there the 50 day moving average. However all the European problems and now China’s forecast slowdown could be more than the markets can handle. If that is the case then raising cash will remaining one of the best strategies until the market regains its footing and moves higher.

Recent Outlooks

Stock Market Outlook For Thu Nov 5 2026 – Choppy Dip Possible Ahead Of October Non-Farm Payroll Numbers

Prior Trading Day Summary On Wed Nov 4 2026 stocks soared higher on the back of the mid-term elections being completed and the results being accepted by President Trump. This meant for investors that the mid-term concerns were over no …

Morning Investing Strategy Notes for Wed Nov 4 2026

For FullyInformed Members the morning Investing Strategy Notes for Wed Nov 4 2026 discuss Tuesday’s bounce and the outlook for equities following the mid-term elections. Equities reviewed today include Advanced Micro Devices Stock (AMD), ARM Stock (ARM), Qualcomm Stock (QCOM) …

Stock Market Outlook For Wed Nov 4 2026 – Lower Following Mid-Terms

Prior Trading Day Summary On Tue Nov 3 2026 stocks attempted a second bounce. While strength was limited, the SPX and NASDAQ managed to close positive ahead of the mid-terms. The S&P closed up 27 points to end the day …

Morning Investing Strategy Notes for Tue Nov 3 2026

For FullyInformed Members the morning Investing Strategy Notes for Tue Nov 3 2026 discuss Monday’s lost bounce and the outlook for today and Wednesday. Equities reviewed today include Apple Stock (AAPL), Palantir Tech Stock (PLTR), Advanced Micro Devices Stock (AMD), …

Stock Market Outlook For Tue Nov 3 2026 – 2nd Bounce Possible But Mid-Terms Dominate

Prior Trading Day Summary On Mon Nov 2 2026 stocks opened higher and tried to build on the early rally. But as explained in yesterday’s outlook, the bounce on Monday would have a hard time holding its gains with the …

Morning Investing Strategy Notes for Mon Nov 2 2026

For FullyInformed Members the morning Investing Strategy Notes for Mon Nov 2 2026 discuss Friday’s sell-off and the outlook for November. Included are some investing tips for sell-offs. Equities reviewed today include Apple Stock (AAPL), Shopify Stock (SHOP), Palantir Tech …

Stock Market Outlook For Mon Nov 2 2026 – Bounce Likely After Friday’s Sell-Off and Ahead of Mid-Terms

Prior Trading Day Summary On Fri Oct 30 2026 stocks plunged as the ai trade took another hit. Tech stocks took the brunt of the sell-off which saw the S&P lose 140 points for a drop of 1.82% and a …

Morning Investing Strategy Notes for Fri Oct 30 2026

For FullyInformed Members the morning Investing Strategy Notes for Fri Oct 30 2026  review the outlook for equities following disappointing earnings from a number of tech stocks. Equities discussed today include Amazon.com Stock (AMZN), Intel Stock (INTC), Estee Lauder Stock …

Stock Market Outlook For Fri Oct 30 2026 – Lower On Earnings Disappointment

Prior Trading Day Summary On Thu Oct 29 2026 stocks ended the day lower as fallout from the plunge in Alphabet Stock (GOOGL), Fortinet Stock (FTNT)  and others lead to an expansion in the selling. Alphabet Stock (GOOGL) had its …

Morning Investing Strategy Notes for Thu Oct 29 2026

For FullyInformed Members the morning Investing Strategy Notes for Thu Oct 29 2026 review the outlook for equities following yesterday’s latest earnings from Microsoft, Alphabet and more. A lot of trades are planned for today. Equities discussed today include Crowdstrike …

Stock Market Outlook For Thu Oct 29 2026 – All About Earnings

Prior Trading Day Summary On Wed Oct 28 2026 stocks continued their rally although market breadth was more mixed. The SPX rose 21 points to close at 7744. Volume was 5.5 billion with 49% of all trades moving lower and …

Morning Investing Strategy Notes for Wed Oct 28 2026

For FullyInformed Members the morning Investing Strategy Notes for Wed Oct 28 2026 review the outlook for equities for Wednesday and a look at the Fed interest rate announcement for today. Equities discussed today include TQQQ, Microsoft Stock (MSFT), Alphabet …

Stock Market Outlook For Wed Oct 28 2026 – All About The Fed And Bullish

Prior Trading Day Summary On Tue Oct 27 2026 stocks continued with their rebound rally. The SPX closed at the 21 day moving average despite 700 million less shares being traded. The SPX rose 45 points to close at 7722 …

Morning Investing Strategy Notes for Tue Oct 27 2026

For FullyInformed Members the morning Investing Strategy Notes for Tue Oct 27 2026 review the outlook for equities for Tuesday. Equities discussed today include TQQQ, Microsoft Stock (MSFT), VISA Stock (V), Seagate Stock (STX) and more. The morning Investing Strategy …

Subscribe For The Latest News