Today’s enormous Market Direction move higher on the back of European debt news has left the market in a strong overbought position. Therefore there could be more highs ahead shortly, but I would expect some pullback in the very near future.
But should there be any concern if the market direction changes to back down in the short-term?
Market Timing / Market Direction – A Collective Sigh
Today was a euphoric sigh by the market that European politicians are finally acting and accepting that there is a debt crisis and it must be addressed. Whether a 50% default on Greek debt is the kind of resolution that benefits Europe is something that only time will tell. I have been bearish on the markets since May and while I remain cautious the move up from October 4th has to be acknowledged as an excellent move for the major indices, in particular the break higher from the range the market has been stuck in for over 3 months.
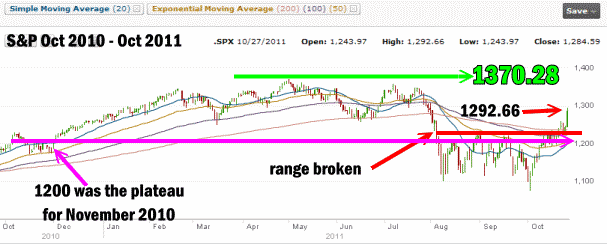
The S&P is now just 77.63 points away from the high set back on May 2 2011.
Market Timing / Market Direction: Is The Bear Market Going Back To Hibernation?
To determine if the bear market will hibernate for the winter, it is interesting to look at the S&P500 chart below for the past year. The market high of May 2 at 1270.28 is clearly shown.
Market Timing / Market Direction – The All Important 1260 Level
The range being broken is also shown and today’s collective sigh has moved the market above the 1260 level, which I indicated many times, the S&P must recapture and hold if it wants to move back into bull territory.
Market Timing / Market Direction – The 1200 Level
With today’s activity, it becomes important for the S&P to not fall below 1200 if the bulls want any chance of recovering from the past months of selling. 1200 is important because it is the level the market was in back in November 2010 and which it built a base of support to commence the run up to the May 2nd high. It was not surprising that many times in this bear market the S&P revisited that 1200 level. (Pink line in chart above)
Therefore with support at 1200 from a year ago and the market in the last 3 months continually revisiting 1200, this level is an important milestone based on the range the market was in during the most severe part of the recent bear activity.
WATCH 1200 LEVEL IN THE NEXT ROUND OF SELLING
When selling does return after this terrific rise in the S&P, the market could pullback to around 1200. Such a pullback would not concern me and I would be selling out of the money puts if that occurs.
BUT any pullback below 1200 has to raise a caution flag for investors.
Just remember that the market direction will not be straight up so weakness after such a terrific day has to be expected. Aside from this however, I will not be surprised to see the S&P try to set a higher high even tomorrow or Monday before more selling ensues. It may not hold at a higher high and I would doubt that after such a great run up, but bulls may still try.
BACK TO THE SPY PUT HEDGE
Meanwhile though I will look to use my SPY Put hedge if the market direction turns down sharply enough and the Ultimate Oscillator readings show overbought which would be my cue to buy spy puts.
Market Direction / Market Timing – What the Moving Averages Are Saying
As to market timing, the most interesting aspect is the moving averages of the 20 day simple moving average (SMA) and the 50, 100 and 200 exponential moving averages (EMA).
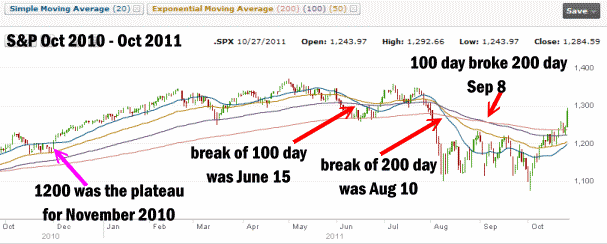
On the chart below I have pinpointed the first break on June 15 when the market direction turned severely down and the 20 day crossed the 100 day EMA. The 20 day had broken through the 50 day just a few sessions earlier when the market direction had started to turn down, which was a market timing indicator of a severe downturn ahead. When the 100 day fell quickly apart within just a few sessions it confirmed the market timing call.
Market Timing – The 200 Day EMA Broke
It took the market not quite two months for the 20 day SMA and the 50 day to break through the 200 day EMA and then by early September the 100 day broke the 200 day signalling a major downturn was not only underway but could become a lot worse.
The recent rise from Oct 4 is now turning all the moving averages back up however none have crossed any of the important thresholds to confirm that the market direction has changed for the better. But the rise from Oct 4 has been fast and furious, albeit on light volume as many hedge funds and institutional investors left the market back in August and have not returned in large purchases.
LIGHT VOLUME CAN OFTEN HELP THE MARKETS
The market direction can easily move higher without their participation and in fact could actually move higher without their volumes as lighter volume can often move a market to more extremes.
Personally I think the moving averages have not caught up because the market direction being up since Oct 4 has been strong and pronounced and a lot of it has not been supported by the other technicals such as RSI and MACD which at varying times during the rally indicated that it was in fact running out of steam.
For those investors who rely on moving averages market timing they may wish to wait for the clear sign of the 50 day EMA and 100 day EMA breaking through the 200 day EMA before returning to the markets.
Market Timing / Market Direction – Socio-Economic Forces At Work
CONGRESS
This bear market and the recent run back higher since early October has a lot to do with socio-economic forces than just a normal recessionary bear market.
The lack of co-operation by Congress to come up with a solution to the debt ceiling and make any serious efforts to co-operate for long-term debt reduction had a serious impact on the market, and indeed the sentiment of the consumer.
EUROPEAN POLITICIANS
In Europe the “stick your head in the sand” approach to managing the Euro and Debt crisis created grave concerns among investors and the public in general. Indeed if Europe is in a recession and by all appearance this does seem to be the case, the politicians have no one to blame but themselves. They set the continent up for this crisis when they allowed member nations to basically “fudge” numbers to enter the EU. It is impossible for sovereign nations to set up entitlement programs when taxation and revenue structures are not in place to pay for such programs. This is simple accounting and yet it has been ignored not only in Europe but around the world as politicians everywhere win the seats of governments based on cutting personal taxes but fail to recognize that they must also cut spending to cover the decrease in revenue from tax cuts.
50% GREEK HAIRCUT
Just like the sub-prime mess, banking crisis, housing crisis, GM Bankruptcy, and many other debacles, in which governments refused to accept that the problem exist and work to resolve them, European Governments attempted to convince the public that there was no real problem in Greece or any member nation.
In the end, investors knew there would be a default and the collective sigh of relief today in the market was not investors approving the European Debt Deal, but simply being happy that finally Europe’s politicians have admitted there is a problem, acted on and accepted that Greece must default.
UNCERTAINTY IN THE MARKET
It is uncertainty in the market that investors hate. For 6 months the market has been hammered by everything from inept politicians to media channels speculation to rumors. Today some of those clouds departed and that is what investors were looking for.
Market Timing / Market Direction – Oct 27 Summary – What MACD Says
While I have hopes that the bear may go into hibernation this winter, I will not stray from the cautious bull strategy. This financial investment strategy has saved my portfolio time and again. The past 6 months has seen terrific portfolio gains and no capital losses, thanks to the cautious bull.
Is the bear market going into hibernation for the winter? The market timing indicator of the MACD used by the traders almanac for many years indicates that a buy signal was generated in the middle of October and often it can herald a climb of 15% into March or April of the following year.
With the European Debt Crisis kicked a lot further down the road, I would expect selling up ahead just due to the overbought conditions in the market, but perhaps the market direction will move back to sideways with a bias higher. If the S&P falls below 1200 then probably the bear won’t sleep much this winter and the MACD Market Timing call could be wrong and the market direction may be back to sideways with a bias to lower.


