Market Timing has always had a checkered history. Many investors believe it holds little value in the normal course of investing. Other investors believe market timing is a myth that cannot assist them even with buy and hold or buying for dividend style investing.
This morning I was reading an article on seeking alpha where the author pointed out a number of reasons why stocks “could” crash shortly. He pointed to the rise so far this year in equities as overdone. He indicated that such a rise is not just overdone but is not sustainable and a crash is in the cards.
He pointed to the middle east and the nuclear question posed by Iran and the likely Israeli response as another reason stocks will crash.
He pointed to the recent trade deficit in China as a sign of the world’s overall slowdown caused in part by Europe as another sign that the current rally in stocks is unjustified bringing the stock market every day closer to a crash.
Last he pointed to the “sell in May” phenomena as a fourth reason to exit the markets now.
Market Timing Can Help
One thing that these have in common is, they are events I as an investor have absolutely no control over. Market Timing has taught me that stress in market places can be spotted by market timing technical indicators before it gets to the point of a crash.
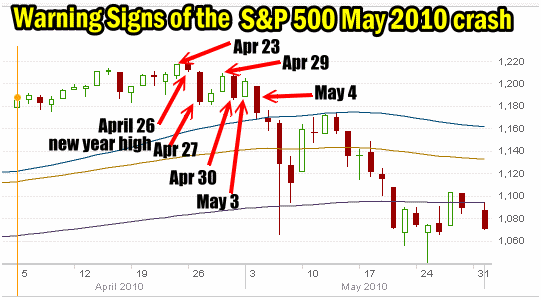
Even the worst day in the market’s history, May 6 2010 when supposedly, computers made an error and the S&P collapsed 98.59 points or 8.4% actually had warning signs from market timing technical indicators. The market timing events leading up to the May 6 2010 market crash are plotted on the S&P 500 chart below.

S&P 500 Chart Showing Market Timing Pinpoints Warning Of Impending Correction
Market Timing Indicators Warned Of A Correction
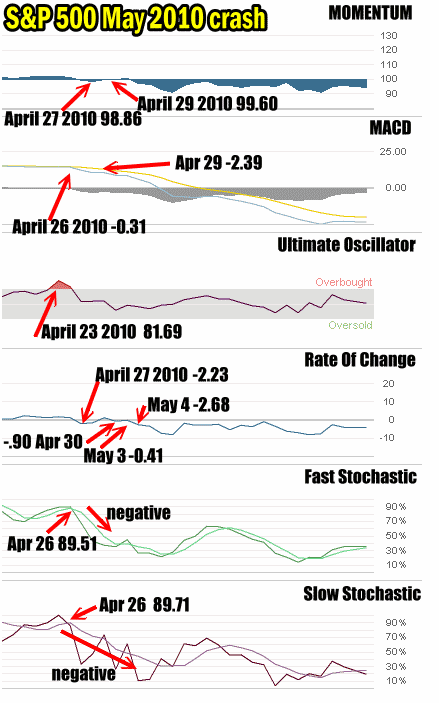
The market timing chart below from that period in April to May 2010 shows the many warning signs that market timing indicators flashed to investors that the market was in trouble. Indeed starting on April 23 2010 I indicated that my market timing indicator the Ultimate Oscillator was flashing extremely overbought as the market pushed to new highs for 2010. Below the chart are the other market timing indicators I plotted out in April and May 2010 that warned that a market correction was in the works.

Market timing indicators for April to May 2010 that showed warning signs of impending market correction
On April 23 the Ultimate Oscillator flashed the extreme overbought condition and as that condition began to decline, the other indicators all began to flash warnings.
On April 26 the S&P 500 made another new high but failed to close above the previous day’s high. This is a classic topping action. Here are all the warning signs:
Market Timing Indicator – MOMENTUM:
On April 27 Momentum turned negative at 98.86. Two days later as the market struggled to push back up, momentum stayed negative with a reading of 99.60. From there, momentum turned decidedly more negative each day.
Market Timing Indicator – MACD (Moving Average Convergence / Divergence):
MACD on April 26 gave a negative reading of just -0.31. But following that reading it failed to again turn positive. Two trading sessions later it was already -2.39 and continued to fall despite the S&P 500 trying to rally back to its recent new high. This was a classic warning that the rally back up was nothing more than a short-term bounce.
The market timing indicator Ultimate Oscillator I have already discussed. It was the first to signal a possible market direction change on April 23 2010.
Market Timing Indicator – RATE OF CHANGE:
Rate of Change (ROC) flashed a warning on April 27 with a negative reading of -2.23. From that point forward the readings continued to point to trouble in the stock market. Even on May 3 as the market attempted a second move up the reading was still negative at -0.41 and the following day it turned decisively negative with a reading of -2.68 and fell from there.
Market Timing Indicator – FAST STOCHASTIC:
On April 26 the Fast Stochastic pinpointed a decline in the market and turned negative and stayed negative despite the market attempting to rally back to its new most recent yearly high.
Market Timing Indicator – SLOW STOCHASTIC:
The same day as the Fast Stochastic flashed its change of market direction notice, the slow stochastic confirmed it and then turned negative despite the two rally attempts following the most recent yearly high on April 26.
Market Timing Summary
Market timing is always going to be a checkered character and much of this is because of investors and how their perceive market timing tools. The belief among most investors is that market timing does not work because it is not “clear” enough. What investors are seeking is absolute assurances of a market direction change and solid numbers of where to expect the market to correct to. In other words they want market timing to tell them where to buy and where to sell and exact entry and exit points.
There is no holy grail for investing that will be the perfect tool to use to both pinpoint exactly how far a market will fall or rise. There is no product available today that will tell an investor when to buy and when to sell and capture 100% of the returns each time. These types of products have never existed.
Many investor actually do not understand market timing at all. This Wikipedia article on market timing may be of interest as it presents both sides of the argument.
So while market timing tools in late April and early May 2010 flashed warning signs of a possible correction it is true that they could not pinpoint the day of the crash and certainly how low the market would fall. Investors use such evidence to argue that market timing tools do not work.
This is a shame because by combining market timing indicators with common sense, personal investing experience and sound investing strategies, any investor can benefit enormously by not just seeking to earn income from market direction changes, but by also being capable of protecting their positions as markets weaken and to prepare to take advantage of what could end up being fire sale prices on equities in any market collapse.
On May 6 2010, when the S&P 500 crashed, there were bargains galore which in many cases lasted only a matter of a few minutes as bargain hunters stepped in quickly to take advantage of what was obviously a one day collapse.
As you can see from my look at the May 6 2010 market collapse, as an investor I may not be able to predict the day of a collapse or the low point in any collapse, but I can use market timing indicators each day to watch the market and listen to what these tools are trying to tell me and become a better investor.
Market timing tools if used daily allow an investor to peer through the doom sayers, analysts, endless talking tv personalities, ever worried economists, personal financial planners, and look at what the stock market is actually doing.
Market timing indicators can go a long way to helping investors earn profit and income if they would set aside their personal prejudices and opinions and consider them for exactly what they are, tools that can often assist in spotting market direction changes.
