
My market direction outlook for Monday was for a lower market. Basically the technical indicators pointed to Friday’s run-up as just a technical recovery and nothing more. Seems at this time they are right. Meanwhile the S&P 500 attempted to hold to the 1680 level for a short while and then broke through it. My outlook is for the S&P 500 to retest the low from last week which was at 1670.36 for basically, 1670.
It’s rare when the stock market plunges lower and recovers for it not to attempt to retest the low again. This need to be watched for tomorrow and the early part of this week to make sure that when 1670 is tested, the market managed to hold on.
Who Will Blink First
The market direction continues to remain fixated on the debt ceiling crisis. Now world governments are voicing their concern as well but both sides in the debt ceiling fiasco seemed completely entrenched. It has become a game of chicken for politicians. Nowhere do we hear about compromise and working together for a resolution that will benefit the country and keep the economic recovery ontrack. It has become a question of who will blink first and both sides are determined it will not be them.
Market Direction Intraday Chart for Oct 7 2013
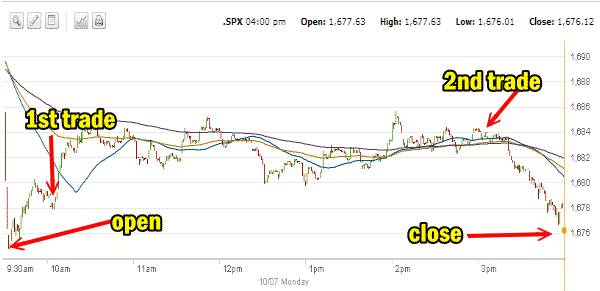
In the one minute intraday chart below I have marked the key points for today. At the outset the market dropped below 1680 again. This told me that support at 1680 is very much weakened. Investors interested in still buying stocks will move lower now that 1680 has been broken through a number of times. Why buy stocks at present prices if there is a good chance they will be cheaper shortly. My first trade of the day was around 10:00 AM when I bought IWM calls using the Trading For Pennies Strategy. I wrote about it on the members site. This has become an incredible strategy over the past few weeks as the stock market direction has continued to remain weak. My second trade was with Spy Put Options later in the day. While not spectacular it was still an easy trade. Meanwhile the most disappointing part of the day was the ease with which the market direction fell right back through 1680 and closed near the lows for the day.
DOW Index Heading Toward 200 Day EMA
Meanwhile the Dow also closed near the lows for the day and lost the 15,000 level again. The 15,000 level for the Dow has been tough. The index has had a lot of trouble pushing convincingly above it. Instead with today’s decline which wiped out all of Friday’s gains and more, the Dow seems intent on moving toward the 200 day exponential moving average (EMA). If it does, the other indexes will eventually take notice and follow.
Advance Declines For Oct 7 2013
Declining issues were huge today which does not bear well for tomorrow and the rest of the week. Declining issues comprised 76% of all issue with advancing issues just 21%. New highs were just 60 with new 52 week lows at 99. New highs and new lows were not actually too bad today but the declining issues is a definite cause for concern.
Market Direction Closing For Oct 7 2013
The S&P 500 closed at 1,676.12 down 14.38 or almost a full percent. We are now below 1680 again. The Dow closed at 14,936.24 down 136.34. The NASDAQ closed at 3,770.38 down a percent with a drop of 37.38. The NASDAQ continues to try to lead this market but the Dow is the major concern now. IWM ETF (Russell 2000) fell more than a percent today but still is a ways above its 50 day simple moving average (SMA). Remember though, don’t listen to the analysts who talk up the small and mid cap stocks. If the market direction does turn further down than IWM will catch up very quickly. These are small and mid cap stocks. Investors bail on them in a heartbeat if it looks like the market direction lower will become a bit more severe.
Market Direction Technical Indicators At The Close of Oct 7 2013
Let’s review the market direction technical indicators at the close of Oct 7 2013 on the S&P 500 and view the market direction outlook for Oct 8 2013.
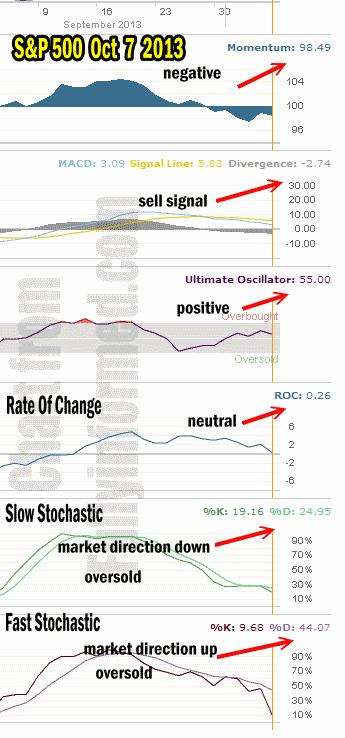
For Momentum I am using the 10 period. Momentum is continuing to stay negative and while Friday pulled it back up a bit, today saw momentum turn further lower.
For MACD Histogram I am using the Fast Points set at 13, Slow Points at 26 and Smoothing at 9. MACD (Moving Averages Convergence / Divergence) issued a sell signal on the S&P 500 on Sep 30 which was confirmed Oct 1. MACD has not been wrong in over a year now. Today the sell signal continued to grow negative.
The Ultimate Oscillator settings are Period 1 is 5, Period 2 is 10, Period 3 is 15, Factor 1 is 4, Factor 2 is 2 and Factor 3 is 1. These are not the default settings but are the settings I use with the S&P 500 chart set for 1 to 3 months.
The Ultimate Oscillator is interesting. It remained positive today despite the huge number of declining shares.
Rate Of Change is set for a 21 period. The decline in the rate of change continued but slowed somewhat with it staying more neutral than negative.
For the Slow Stochastic I use the K period of 14 and D period of 3. The Slow Stochastic is signaling that the market direction is down. It is oversold.
For the Fast Stochastic I use the K period of 20 and D period of 5. These are not default settings but settings I set for the 1 to 3 month S&P 500 chart when it is set for daily. The Fast Stochastic is signaling that the market direction for tomorrow is down strongly. K period with a reading of just 9.68 is oversold to the extreme but the D reading of 44.07 is strongly negative.
Market Direction Outlook And Strategy for Oct 8 2013
The S&P looks set to challenge the 1670 level for a second time. This is important for the market direction. The Dow has been slipping for some time but the S&P which is the broader market has managed to hold itself to the 50 day simple moving average (SMA) and while continually testing support at the 50 day it has not yet broken through decisively.
Support levels in the S&P 500 are weak until the market direction gets down to 1600. 1680 has the next support outside of 1600. the rest of the move down has light support at 1670 and 1650. There is a small band of support around 1625 to 1628 but that could easily break.
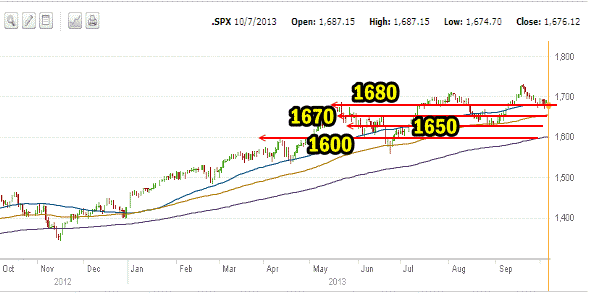
The 1670 level is important. We may find out in a day or two how the market direction is handling the debt ceiling coupled with earnings as we start earnings season tomorrow with Alcoa Stock.
Personally I will probably be picking up DXD shares tomorrow again in the market direction portfolio. I should have bought today but I was busy with other trades. My concern has been that if the debt ceiling is resolved quickly and decisively here the market direction will immediately shift back to up and the market quickly attempts to break this latest downturn by coming roaring back up. I did not wish to get caught in that. You can also tell by the market direction drop in the morning and then buying back after that drop that a lot of investors are feeling the same way. We can’t all be right. Whether these politicians are so entrenched that they end up like little children with temper tantrums and indeed let the US default. Personally I cannot imagine them doing this but today with politics so polarized it could happen.
Tomorrow then the market direction technical indicators are back pointing to continued weakness and a lower day. We already dropped down today almost a full percent in the S&P. We cannot keep the whipsaw action for much longer before the market direction will break down as each day like today continues to do technical damage. Let’s hope that we see a reasonable outcome to the present financial crisis. Tomorrow should see the market direction move lower once again.
Market Direction Internal Links
Profiting From Understanding Market Direction (Articles Index)
Understanding Short-Term Signals
Market Direction Portfolio Trades (Members)