
The market direction outlook for Tuesday was for stocks to try for a higher close. That did not happen as the Federal Reserve president Richard Fisher said that “this program cannot go on forever” in reference to the ongoing Quantitative Easing program. These continual side comments from Fed presidents seemed designed to curtail investor enthusiasm and then within a day or two they seem forgotten and stocks once more move higher. But Fisher also is reported as saying “Our balance sheet has become bloated and, at some point, we will have to taper back on the pace of purchases, but that doesn’t mean we’ll stop.” These kinds of statements continue to befuddle many investors and today’s action show this.
Fed comments continue to hinder most base metals, gold and even the price of oil continues to slip. Gold is now well below $1300, trading today around $1271 an ounce.
Market Direction S&P 500 Intraday For Nov 12 2013
Yesterday the S&P 500 market direction was flat and sideways. The chart below is from Monday Nov 11 and you can see just how flat the day was.
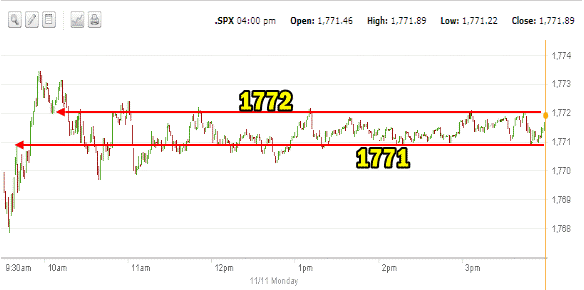
Intraday market direction for Nov 11 2013
The intraday S&P 500 chart for today (Nov 12) shows a different picture. Today’s market moved higher and then lower. It left open a gap at 1771 in the early morning which was not filled during the day. 1768 was the principal valuation of interest during today and the S&P managed to close near it at $1767.69. Support for the present rally is lower at $1750. If that support should break then the S&P 500 will most likely fall back to around $1725.
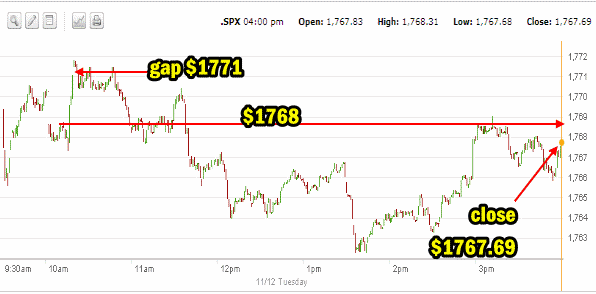
Intraday market direction for Nov 12 2013
Advance Declines For Nov 12 2013
Today declining issues outpaced advancers with 61% of all stocks declining versus 36% advancing. New highs were just 107 and new lows 96. These numbers show the pressure stocks are now facing.
Market Direction Closing For Nov 12 2013
The S&P 500 closed at 1,767.69 down 4.20. The Dow closed at 15,750.67 down 32.43. The NASDAQ closed at 3,919.92 up 0.13 marking the second straight day of almost neutral movement. The IWM ETF was almost unchanged as well closing at $109.47 up just 0.09 cents.
Market Direction Technical Indicators At The Close of Nov 12 2013
Let’s review the market direction technical indicators at the close of Nov 12 2013 on the S&P 500 and view the market direction outlook for Nov 13 2013.
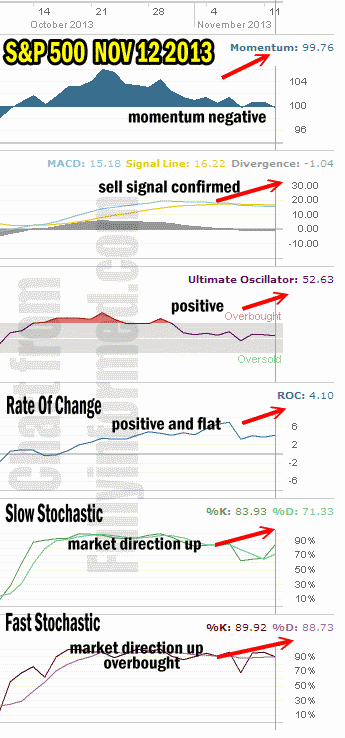
For Momentum I am using the 10 period. Momentum turned slightly negative today at the close.
For MACD Histogram I am using the Fast Points set at 13, Slow Points at 26 and Smoothing at 9. MACD (Moving Averages Convergence / Divergence) issued a sell signal on Nov 7, but it was not confirmed on Friday and again today. MACD gave a weak confirmation of the sell signal from Nov 7 with a reading of negative 1.04. The sell signal on Nov 7 was negative 1.02 so today’s signal while a possible confirmation is so close to Nov 7th signal that is could be questionable.
The Ultimate Oscillator settings are Period 1 is 5, Period 2 is 10, Period 3 is 15, Factor 1 is 4, Factor 2 is 2 and Factor 3 is 1. These are not the default settings but are the settings I use with the S&P 500 chart set for 1 to 3 months.
The Ultimate Oscillator is still positive and staying flat.
Rate Of Change is set for a 21 period. The Rate Of Change moved sideways today with a slight bias higher. It could be pointing to a continuation of the change signal it issued late last week.
For the Slow Stochastic I use the K period of 14 and D period of 3. The Slow Stochastic is signaling that the market direction is up.
For the Fast Stochastic I use the K period of 20 and D period of 5. These are not default settings but settings I set for the 1 to 3 month S&P 500 chart when it is set for daily. The Fast Stochastic is signaling that the market direction is up for Wednesday and it is still extremely overbought. It is important to note that the readings of the Fast Stochastic are indicative of an up signal but they are also close to a neutral reading.
Market Direction Outlook And Strategy for Nov 13 2013
You can see just how tight the market direction is trading in by the signals coming from the Market Direction Technical Analysis. MACD “sort of” confirmed the down signal today but the readings were so close it is a tough call. The Fast Stochastic is signaling up for tomorrow but the readings are so tight it could be more sideways than up. The Ultimate Oscillator is flat with hardly a change from yesterday. Momentum is negative but at a reading of 99.76 it is a very tight negative reading which could be construed more as neutral than negative.
Of interest is the slow stochastic which is used to predict more than a day out. According to the slow stochastic market direction may turn back to up shortly. This could mean that we will see some more weakness on Wednesday and then a move to the upside later in the week but possibly from a lower level.
The other technical indicators are so plentiful to the neutral to down with their readings that they all but negate the slow stochastic signal. Nonetheless if the slow stochastic signal does hold any information it is probably to tell us that if the market direction does move lower it will be an opportunity for more trades and not the beginning of a major move lower.
One other event that is ongoing at present and which I am writing about in a second article this evening is the annual year-end window dressing that goes on by fund managers. This in itself is helping to keep stocks up and propping up the markets in general. You can read more about that in the second article I have posted.
The opening tomorrow could see the S&P move higher at the outset to try to fill that gap around 1771 but pressure to the downside will remain.
Overall for tomorrow then the market direction looks set to stay under pressure but any selling will probably be met by buyers so I am not expecting any move lower will be hugely dramatic. Therefore with the sell signal “sort of” confirmed and many indicators turning negative, we will probably see more weakness in the market direction tomorrow and the bias is to a lower close for Wednesday.
Market Direction Internal Links
Profiting From Understanding Market Direction (Articles Index)
Understanding Short-Term Signals
Market Direction Portfolio Trades (Members)