
Market Direction today ended up once again following the market direction technical indicators. The weakness we saw yesterday in market direction has continued today. So far though it is nothing but weakness while the market consolidates further. There was plenty of activity and you can tell from volumes of a lot of stocks that bigger players are adjusting positions as they take profits in some stocks and prepare positions in other stocks.
The key for those of us who like options is to keep referring to your watch list and look for stocks that exhibit the movement you are seeking. For example, I prefer Put Selling as my principal method of investing and I am busy Put Selling here and there in small quantities on some of my favorite stocks that are taking dips just now.
Market Direction Action For March 13 2013
The best news today came from the Commerce Department that reported retails sales rose 1.1 percent in February which was well ahead of expectations and the biggest fain in five months. This could also signal that the higher payroll taxes are not going to impact retail as much as was expected. Whatever the case, it shows that consumers are pretty resilient. The retail numbers buoyed analysts who are now looking for a better GDP out of the US than previously forecast. TD is looking for 2.5 percent and CIBC believe growth with hit 3 percent annualized. Most analysts have now taken a prediction of 1% growth for GDP off the table.
This again is a two-edged report. If the economy continues to improve than the Fed will bring closure to liquidity which is what has driven stocks up. But if earnings continue to improve stock valuations can be maintained on many stocks. It’s a tough call for investors and one of the reasons I am staying with the strategy of “stay cautious but stay invested”.
Market Direction Closings
The S&P 500 closed at 1554.52 up 2.04 and the Dow closed at 14455.28 up 5.22 for another record close, up 5.22 points. The NASDAQ closed at 3245.12 up 2.80.
Market Direction Technical Indicators At The Close of Mar 12 2013
Let’s take a moment now and review the market direction technical indicators at today’s close on the S&P 500 and view the next trading day’s outlook.
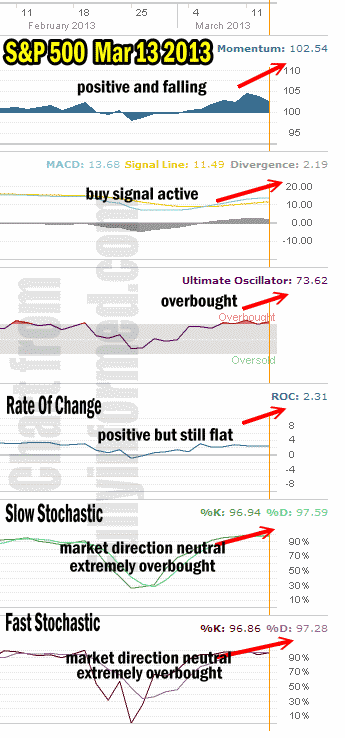
For Momentum I am using the 10 period. Momentum is still positive but this marks the second day that momentum is reflecting a downward pressure on the overall market direction. Nonetheless it is still positive which indicates this is still just consolidation.
For MACD Histogram I am using the Fast Points set at 13, Slow Points at 26 and Smoothing at 9. MACD (Moving Averages Convergence / Divergence) is still positive and the buy signal remains active.
The Ultimate Oscillator settings are Period 1 is 5, Period 2 is 10, Period 3 is 15, Factor 1 is 4, Factor 2 is 2 and Factor 3 is 1. These are not the default settings but are the settings I use with the S&P 500 chart set for 1 to 3 months.
The Ultimate Oscillator is positive and back pushing into overbought territory. This is a good sign for the market direction. Although usually overbought in the Ultimate Oscillator signals that the market direction may change to down, in a bull market it is often a sign of strength. With the market direction not slipping, this is indeed indicative that the market direction up remains intact.
Rate Of Change is set for a 21 period. Rate Of Change is still positive but is still flat or unchanged for yet another day. If the market direction was on the verge of falling, the rate of change would begin a decline. This has not happened which again points to market consolidation.
For the Slow Stochastic I use the K period of 14 and D period of 3. The Slow Stochastic is overbought to the extreme and the K period and D period readings as so close that this almost always indicates a neutral stance.
For the Fast Stochastic I use the K period of 20 and D period of 5. These are not default settings but settings I set for the 1 to 3 month S&P 500 chart when it is set for daily. The Fast Stochastic is also extremely overbought and unlike yesterday, the D and K period readings are close enough to signal that the market direction is more neutral than up or down.
Market Direction Outlook And Strategy for Mar 14 2013
The market direction outlook for March 14 continues to remain sideways. The bias presently is almost equal up or down but one thing is clear, the market is consolidating. This normally means a push higher will commence. Right now though only MACD is signaling that the market direction is higher. Two indicators are neutral and two are signaling market direction consolidation. At present then my strategy remains exactly the same. I am trading where I see opportunities in my watch list of stocks and I am waiting for a clear signal to either pull back and raise some additional cash or to apply more of my capital to my trades. The great thing about my Put Selling is even though the quantities have been reduced I am continue to profit and watch my capital compound. Market direction then is almost unchanged in its outlook. No big down days in the foreseeable future but no big up days yet either. My instincts keep telling me we will move higher but the market direction technical indicators are continuing to advise caution. I would be advised to stay with the technical indicators for market direction and put my guessing aside.
Internal Market Direction Links
Profiting From Understanding Market Direction (Articles Index)
Understanding Short-Term Signals
Market Direction Candlestick Daily View (Members only)
Market Direction Portfolio Ongoing Trades (Members only)
Market Direction External Links