
The Market Direction outlook for Friday was for the overbought condition to be felt by the markets but the bias remained with the upside. Friday ended up exactly as expected. The selling pressure was there throughout the day but the general direction remained for the market direction to keep pushing higher.
Market Direction Action – New Closing Highs
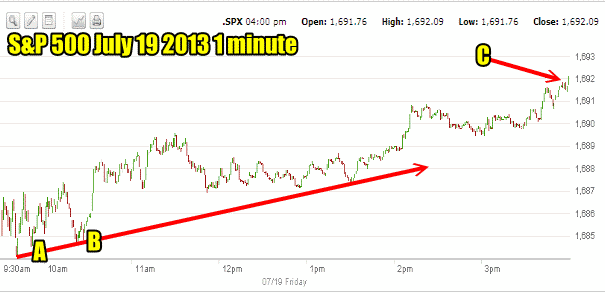
Another new closing high on Friday as the S&P 500 squeaked out a slight gain. The one minute daily chart below though shows what happened on Friday. At the open the market direction sold off but then hit a bottom which I marked as point A where there was very little selling. Instead the market rose back and then retested for support at point B and then climbed the rest of the day until it closed at the high at point C.
Often when the market direction closes at the high on a Friday, the following Monday is weak and we could see that on Monday.
Market Direction Closing For July 19 2013
The S&P 500 closed at 1,692.09 up 2.72 and set another new all-time high closing. The Dow closed at 15,543.74 down just 4.80. The NASDAQ closed at 3,587.61 down 23.66 as technology is continuing to be hammered this time by Microsoft Stock falling 11% by the close.
Market Direction Technical Indicators At The Close of July 19 2013
Let’s review the market direction technical indicators at the close of July 19 2013 on the S&P 500 and view the market direction outlook for July 20 2013.
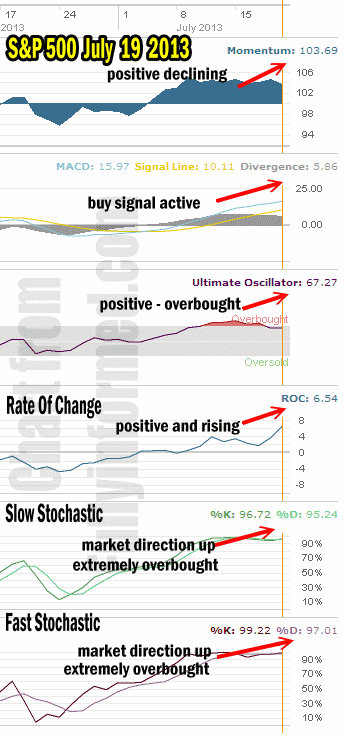
The Market Direction Technical Analysis continues to show strength within the market direction and a general overbought trend.
For Momentum I am using the 10 period. Momentum on Thursday has pushed back up but on Friday as the market direction pushed higher, momentum turned down. It is not a significant downturn but it bears watching.
For MACD Histogram I am using the Fast Points set at 13, Slow Points at 26 and Smoothing at 9. MACD (Moving Averages Convergence / Divergence) issued a buy signal on July 5. The buy signal is continuing to remain strong which is a good sign despite the recent weakness. On Friday MACD turned lower but again this is a short-term signal and at this point it signifies nothing.
The Ultimate Oscillator settings are Period 1 is 5, Period 2 is 10, Period 3 is 15, Factor 1 is 4, Factor 2 is 2 and Factor 3 is 1. These are not the default settings but are the settings I use with the S&P 500 chart set for 1 to 3 months.
The Ultimate Oscillator remains overbought but on Friday is moved out of extremely overbought.
Rate Of Change is set for a 21 period. The rate of change is positive and on Friday it climbed significantly .
For the Slow Stochastic I use the K period of 14 and D period of 3. The Slow Stochastic is signaling that the market direction is up but the overbought condition is extreme in the market direction up.
For the Fast Stochastic I use the K period of 20 and D period of 5. These are not default settings but settings I set for the 1 to 3 month S&P 500 chart when it is set for daily. The Fast Stochastic is indicating that the market direction is up but again the extremely overbought condition of the market is making it difficult for move significantly higher at this point.
Market Direction Outlook And Strategy for July 22 2013
On Friday I sold puts in Microsoft Stock. On Monday should the stock fall lower I will be selling more puts. Meanwhile Canadian Bank stocks are back moving higher and my recent purchase of BNS Stock is turning in big profits, however it is TD Bank that is setting new all time highs.
The internet is being flooded with articles that predict a collapse in stocks this fall. In fact many are predicting a collapse this summer. I don’t see the recent high as signal that the market direction is about to make a double top and then collapse. Instead I think that as long as the Fed is continuing with supportive policies there is little that stocks will do but move higher or at the least sideways.
The market direction technical indicators are pointing to still higher prices for the S&P 500 but there remain signs that the rally could be running on empty. MACD is pulling back as is momentum. In the past, when a Friday has closed at the day’s high, Monday always has seen some selling.
Therefore with strong overbought signals still in the market direction, I believe Monday will be lackluster and the general trend will continue to be sideways with a bias to the upside. I am continuing to use up capital and margin in this environment.
Market Direction Internal Links
Profiting From Understanding Market Direction (Articles Index)
Understanding Short-Term Signals
Market Direction Portfolio Trades (Members)
Market Direction External Links
Market Direction IWM ETF Russell 2000 Fund Info
Market Direction SPY ETF 500 Fund Info
Market Direction Internal Links
Profiting From Understanding Market Direction (Articles Index)
Understanding Short-Term Signals
Market Direction Portfolio Trades (Members)
Market Direction External Links