
Market Direction is almost always driven by investor emotions. Yesterday investors were worried so they sold a few of their stocks but the selling was weak which set up today to be more positive. Today investors liked what they heard from Bernanke which seems somewhat at odds with his comments last month that send stocks tumbling. The about-face by the Fed Chairman can be debated endlessly but the present outlook now is that Quantitative Easing will be with the markets for some time yet. Investors perceive this as good for market direction and were back pushing stocks higher.
Market Direction and Earnings
Earnings continued to improve with JP Morgan releasing strong earnings following yesterday’s drop in Coca Cola and Charles Schwab. IBM’s growth was disappointing but they managed to turn their stock right around with a few encouraging words for investors.
Revenue though is poor and no matter how the analysts present it, revenue is something that is hard to “fudge” and revenue continues to lag prior year’s. Companies have been cost cutting to the bone to keep earnings up. Higher revenues though would be nice as it would prove the US economy is actually growing.
Market Direction and US Dollar
The US dollar was weak again today which helped drive up the price of gold. The weakness in the US dollar certainly appears to be a deliberate move by the Federal Reserve. As long as the dollar declines, stocks should hang in and push the market direction higher.
Market Direction Action – New Closing Highs
The most exciting news today was the market direction closing above the previous May 22 all-time high. The push back to new all-time highs has a lot of the bears coming out of the woods. Many are predicting that the stock market is simply putting in a second top before selling off. Personally I do not see their concerns yet. The Fed is juicing the market direction and that can only mean further new highs for stocks. Eventually there will be a meaningful correction but when that will occur is anyone’s guess.
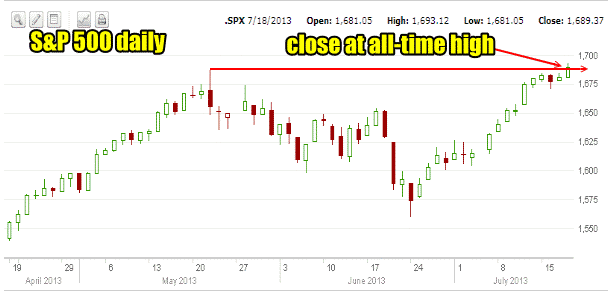
Market Direction Closing For July 18 2013
The S&P 500 closed at 1,689.37 up 8.46 and another new all-time high closing. The Dow closed at 15,548.54 up 78.02 into a new high as well. The NASDAQ closed at 3,611.28 up just 1.28 as technology continues to get hammered.
Market Direction Technical Indicators At The Close of July 18 2013
Let’s review the market direction technical indicators at the close of July 18 2013 on the S&P 500 and view the market direction outlook for July 19 2013.
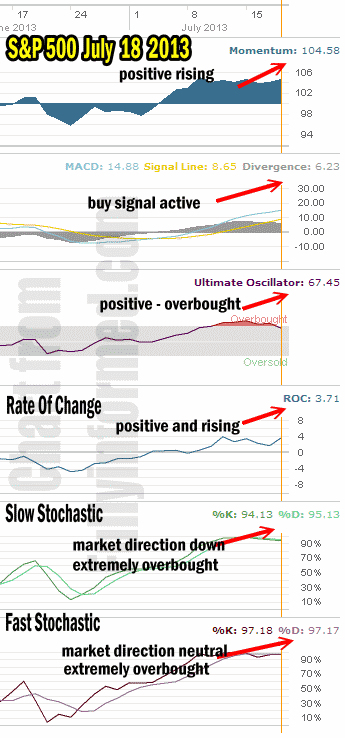 The Market Direction Technical Analysis continues to show strength within the market direction and a general overbought trend.
For Momentum I am using the 10 period. Momentum over the past 3 days has been weak but yesterday momentum turned back up and today it has pushed still higher.
For MACD Histogram I am using the Fast Points set at 13, Slow Points at 26 and Smoothing at 9. MACD (Moving Averages Convergence / Divergence) issued a buy signal on July 5. The buy signal is continuing to remain strong which is a good sign despite the recent weakness. MACD has been very accurate this year so at this point I am continuing Put Selling without hesitation. MACD is also one of the indicators I like to follow for the market direction portfolio.
The Ultimate Oscillator settings are Period 1 is 5, Period 2 is 10, Period 3 is 15, Factor 1 is 4, Factor 2 is 2 and Factor 3 is 1. These are not the default settings but are the settings I use with the S&P 500 chart set for 1 to 3 months.
The Ultimate Oscillator remains overbought but yesterday helped to move it out of extreme overbought territory. Nonetheless the Ultimate Oscillator is overbought and while it can continue to remain overbought for a few more days eventually the market direction will pull back and the overbought condition will work itself out.
Rate Of Change is set for a 21 period. The rate of change is positive and back climbing.
For the Slow Stochastic I use the K period of 14 and D period of 3. The Slow Stochastic is signaling that the market direction is down and it remains extremely overbought. The down signal is very weak however.
For the Fast Stochastic I use the K period of 20 and D period of 5. These are not default settings but settings I set for the 1 to 3 month S&P 500 chart when it is set for daily. The Fast Stochastic is indicating that the market direction is neutral and it too is extremely overbought. This neutral direction is nothing new. Simply the market direction higher is now once more overbought. But the Fast Stochastic is signaling that while there could be some selling up ahead, overall investors are staying put.
Market Direction Outlook And Strategy for July 19 2013
There really is very little weakness in the Market Direction Technical Indicators. In general then the outlook is for stocks to remain strong. I am continuing with my Put Selling and in particular are now watching some of the tech stocks for Put Selling opportunities.
Apple Stock is looking stronger and has held up well to the second retest of the lows of this year. The Apple Stock biweekly Put Selling strategy is continuing to do well. I will begin soon to be using a bit more margin as the market moved higher. This is the perfect environment for Put Selling, with stocks moving higher and the outlook while overbought, still with a bias to the upside.
Market Direction Internal Links
Profiting From Understanding Market Direction (Articles Index)
Understanding Short-Term Signals
Market Direction Portfolio Trades (Members)
Market Direction External Links