
On Wednesday it was all about the Federal Reserve and their decision to continue to taper. But while that may have been the driving force behind the drop again in stocks today, I believe there was also the problem of breadth in the market bounce on Tuesday. In short, the bounce was as we suspected, just an oversold reaaction. Today’s market drop is more what was expected. Let’s take a look at where we are now and where we could be heading shortly.
Market Direction S&P 500 3 Month Daily Chart
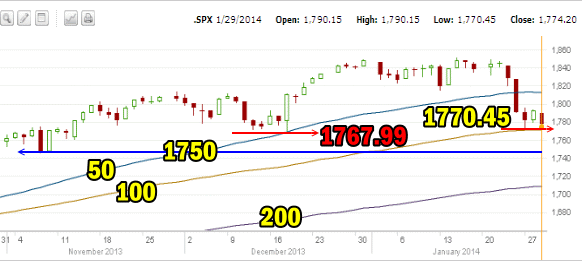
The 3 month daily chart below shows the correction that is now underway. The most important support level in this market remains at 1750 and stocks are just 24 points away. With the correction now down 76.64 points for a drop of 4.1%, a drop of at least 5% should be anticipated. A further drop of an additional 5% would really spook investors at this point. You can see in the chart below that the pattern of higher lows which started in November at the 1750 level has still not been broken. Today stocks hit an intraday low of 1770.45 which is still above the previous low in December of 1767.99. Just a few more points down though and stock will have set up a pattern of lower lows.
Today you can see that the S&P moved back to the 100 day exponential moving average (EMA). it still closed just off the 100 day, but it looks poised to fall below it.
Advance Declines For Jan 29 2014
New lows are starting to build here as pressure to the downside continues to rise. Today 75% of all stocks were declining and just 22% advancing. There were just 36 new highs but 151 new lows as investors continued today to flee stocks.
Market Direction Closings For Jan 29 2014
The S&P closed at 1774.20 down 18.30 of a full percent. The Dow closed at 15,738.79 dropping 189.77. The NASDAQ closed at 4051.43 down 46.53 and nearing 4000.
Meanwhile the IWM ETF fell 1.44% for a drop of $1.63 to close at $111.34 as investors are starting to rush out of small and mid cap stocks.
Market Direction Technical Indicators At The Close of Jan 29 2014
Let’s review the market direction technical indicators at the close of Jan 29 2014 on the S&P 500 and view the market direction outlook for Jan 30 2014.
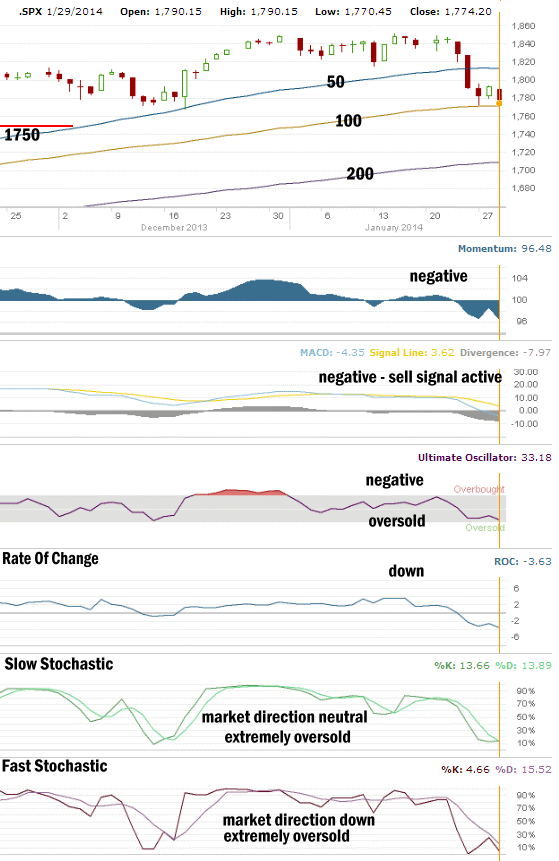
The most important support line in the S&P 500 is at 1750. That support line is holding the market direction up at present and that has not changed. The other support levels that were higher have all been broken and the stocks are clinging to the 100 day exponential moving average (EMA). They look ready to fall below it and challenge the 1750 level. We are now in a full correction.
For Momentum I am using the 10 period. Momentum has been the best indicator over the past two months, replacing MACD as the most accurate indicator. Momentum turned negative on Thursday last week and and is now falling into a stronger negative reading.
For MACD Histogram I am using the Fast Points set at 13, Slow Points at 26 and Smoothing at 9. MACD (Moving Averages Convergence / Divergence) issued a sell signal on Jan 8 2014 which was confirmed on Jan 9. MACD refused to turn positive since Jan 8. Today’s reading is even more bearish.
The Ultimate Oscillator settings are Period 1 is 5, Period 2 is 10, Period 3 is 15, Factor 1 is 4, Factor 2 is 2 and Factor 3 is 1. These are not the default settings but are the settings I use with the S&P 500 chart set for 1 to 3 months.
The Ultimate Oscillator is very oversold and quite negative.
Rate Of Change is set for a 21 period. The rate of change is still negative and is now pushing lower as investors are starting to flee stocks.
For the Slow Stochastic I use the K period of 14 and D period of 3. The Slow Stochastic is signaling that the market direction is more neutral than up or down and it is extremely oversold.
For the Fast Stochastic I use the K period of 20 and D period of 5. These are not default settings but settings I set for the 1 to 3 month S&P 500 chart when it is set for daily. The Fast Stochastic is indicating that the market will move lower and it is back to being extremely oversold.
Market Direction Outlook And Strategy for Jan 30 2014
I am still holding the ultra short DXD shares on the market but unfortunately I did not add to my position. The mood is turning ugly now as investors realize that the first major correction in many months is upon stocks. There are though still a few bright spots. A handful of stocks have continued to push higher as earnings came in better than realized. Stocks like DuPont and Qualcom are good examples of those stocks fighting the trend lower.
However as the pressure builds for stocks to fall even lower, those stocks will also join in the downturn.
VIX Index Strategy
For those investors luckily enough to have rolled their VIX Index strategy options, they are sitting with some decent returns which may move higher in the next several days. I no longer have any options in the VIX Index strategy trade, but I did enjoy very nice returns. Often the VIX Index strategy is one of those that you have to follow a consistent strategy with, to profit from it. I had averaged into my VIX Index options per my article on averaging into these options. Now I have finished selling my handful of call options but it certainly looks like I was too early doing so.
Thursday’s Outlook – Taking My Time
I have sold only a small number of puts over the past several days as I do believe there are lower prices to come. The Fed’s decision to continue to taper further will most likely continue to pressure stocks and push them lower. Whenever stocks turn lower, investors at the outset of a downturn believe that its just a dip and buy. As they continue to commit their capital and stocks fall lower many begin to worry that they were too early. Shortly sellers begin to arrive and stocks sometimes can fall further than expected. This just brings in more sellers.
On Thursday all the technical indicators are pointing to lower prices. In this climate I can continue to take my time putting in place a variety of Put Selling trades. But I am selling options against stocks I would own. That means if I am wrong and the correction that is now underway becomes much more than a typical bull market correction, I will end up holding naked puts that are in the money. Some I will use rescue strategies on but other I will simply keep rolling until that option is no longer available.
For Thursday the technical indicators are advising that the pressure to the downside has not pulled back but instead appears to be building. We could see the market try another bounce attempt but at this point it looks like such a bounce will fail. Stocks looked ready to fall below the 100 day exponential moving average (EMA). That will indeed mark the biggest correction in months.
Market Direction Internal Links
Profiting From Understanding Market Direction (Articles Index)
Understanding Short-Term Signals
Market Direction Portfolio Trades (Members)
Market Direction External Links
Market Direction IWM ETF Russell 2000 Fund Info
Market Direction SPY ETF 500 Fund Info