
The market direction outlook for Tuesday was for stocks to attempt to get a positive close but for weakness to prevail. I wrote yesterday that I was not expecting a break of 1994 on the SPX for Tuesday but if the market closed below 1994, the current rally was over.
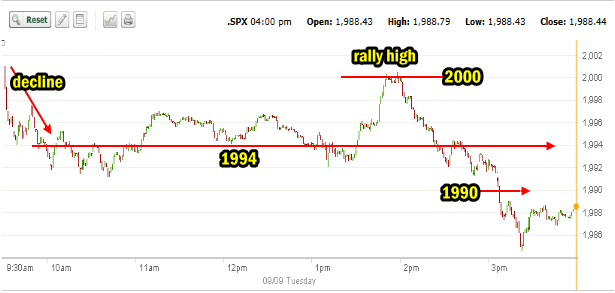
On Tuesday the market direction turned lower and despite an early afternoon rally attempt failed to recover. Analysts for the most part placed the blame on investors consolidating their positions. Personally I think it is a mix of an overbought market and the inability of the market to break to new highs after more than two weeks of trying. With 1994 broken through the market easily fell through 1990 as expected. Let’s look at the one minute chart to start tonight’s review of the market direction action for today.
SPX Market Direction Intraday 1 Minute Chart
The opening started immediately with a decline that by 9:40 had broken the 1994 level. If you recall the various market direction outlook articles for the past two weeks, the 1994 level is the valuation I commented on repeatedly indicating that once it broke the market would easily fall to 1990. By 11:00 AM investors were back and the SPX kept trending sideways along the 1994 level. This seemed to bring in some buyers who pushed the S&P up to 2000 shortly after the lunch hour in the early afternoon. Unable though to hold it, many investors took advantage of the little rally higher to unload positions and they easily broke through 1994. A short rally ensued trying to hold 1994 which failed and the market fell easily to 1990 and the slipped beneath it. The market closed near the lows for the day at 1988.44.
SPX Intraday Sept 9 2014
Advance Declines For Sept 9 2014
One of the problem the market direction has been facing is a lack of volume. Part of the volume problem was the summer months when a lot of investors are on holidays, but volume has also been poor as many investors got out in the last pullback in early August and have not returned despite the rally to new highs. Nervousness is running deep with a lot of investors. Still the bullish sentiment last week was 50% while this week it has fallen to 37%.
Total volume continued to remain poor with just 2.88 billion shares traded. 77% of all volume was to the downside on Tuesday and only 63 new highs were made. At the same time though just 34 new lows were made. While the new lows have ticked up a bit, the number of new highs really fell back today.
Market Direction Closings For Sept 9 2014
The S&P closed at 1988.44 down 13.10. The Dow closed at 17,013.87 down 97.55 and ready to fall below 17000.. The NASDAQ closed at 4552.29 down 40 points.
The Russell 2000 IWM ETF was the worst hit falling $1.38 for a loss of 1.18% and closing at $115.18.
Market Direction Technical Indicators At The Close of Sept 9 2014
Let’s review the market direction technical indicators at the close of Sept 9 2014 on the S&P 500 and view the market direction outlook for Sept 10 2014.
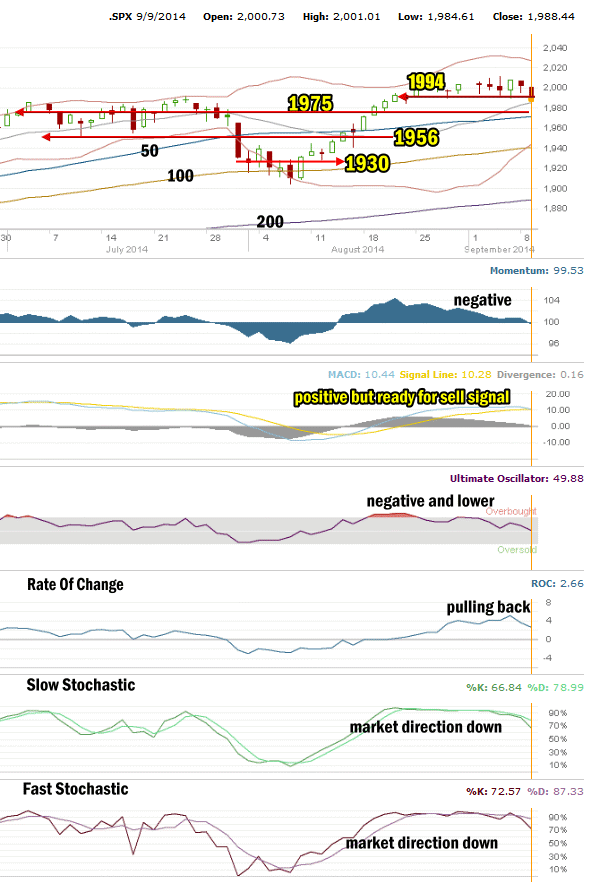
Market Direction Technical Analysis for Sep 9 2014
Stock Chart Comments: The most important event today was the break of 1994 and the quick fall to below 1990. The recovery attempt to recapture 1990 failed and the closure of the SPX below 1990.
1994 Level: I had added in the 1994 level to the SPX chart. You can see that this level was what was struggling to hold the market up. Once 1994 broke decisively the SPX immediately fell to 1990 and then broke. With 1990 broken the next level to fall to is 1975.
1975, 1956 Support: Both are light support and both may be tested in coming days. 1975 is the more significant valuation at this point.
1930 Support: Light support is found at 1930.
Strong Support Levels are at 1870 and 1840 (no longer shown). At present I am not expecting any break of either of these levels.
The other two support levels not shown in the chart above are 1775 and 1750. I have explained that these two are critical support for the present bull market. While 1775 is important it is 1750 that is now the bottom line.
A break of 1750 would mark a severe correction of more than 13% from the most recent high. This would be the biggest correction since April 2012. A pull-back of that size would definitely stun investors at this point and it is not something I am anticipating as there are no signs of any impending correction of that magnitude.
Momentum: For Momentum I am using the 10 period. Momentum has been the best indicator, replacing MACD as the most accurate indicator. Momentum is now negative.
MACD Histogram: For MACD Histogram, I am using the Fast Points set at 13, Slow Points at 26 and Smoothing at 9. MACD (Moving Averages Convergence / Divergence) issued buy signal on Friday August 15. MACD is clinging to positive readings but is ready to issue a sell signal.
Ultimate Oscillator: The Ultimate Oscillator settings are: Period 1 is 5, Period 2 is 10, Period 3 is 15, Factor 1 is 4, Factor 2 is 2 and Factor 3 is 1. These are not the default settings but are the settings I use with the S&P 500 chart set for 1 to 3 months. The Ultimate Oscillator is now negative.
Rate of Change: Rate Of Change is set for a 21 period. Today the rate of change continued to move lower but remained positive.
Slow Stochastic: For the Slow Stochastic I use the K period of 14 and D period of 3. As the Slow Stochastic tries to predict the market direction further out than just one day. The Slow Stochastic is signaling market direction is lower. It is no longer overbought.
Fast Stochastic: For the Fast Stochastic I use the K period of 20 and D period of 5. These are not default settings but settings I set for the 1 to 3 month S&P 500 chart when it is set for daily. The Fast Stochastic is still signaling down and it is no longer overbought.
Market Direction Outlook And Strategy for Sept 10 2014
The most important thing to remember at this point is that we are still in a very strong bull market and this is basically a period of weakness at the present time.
Technically there are a lot of issues but the main issue was the market’s inability to climb higher against a background of strong overbought conditions. The inability of the market direction to hold the 2000 level and then move higher meant that eventually the SPX had to pullback to look for support. Once support is found the market should resume its advance. That though could take several days and probably into next week.
The technical indicators are now 4 negative, one almost neutral (MACD) and one positive but falling which is the Rate Of Change.
But just as the TSX stock market experienced today, fundamentals often can outweigh technical indicators. The break of 1990 sets the market up to test the 1975 level, but this does not mean investors will not try to recapture 1990 and 1994 on Wednesday or Thursday. The problem is the likelihood of success longer-term is still poor. In one month on October 8, Alcoa kicks of the next quarterly earnings. Until then stocks may drift lower or sideways, particular because of the September effect. September is one of the poorest months on record since 1950. That does not mean the market direction will collapse or any such event, but instead the market may continues to experience weakness with rallies and selling being normal until we get closer to the next earnings season.
It would also be nice to see more volume come into stocks as that would lend additional strength to the overall market and assist in less volatility.
For Wednesday fundamentally stocks should try to rally back in the morning. I won’t be surprised if we have further weakness out of the gate tomorrow but then an attempt to rally back. By the afternoon though I am expecting weakness to prevail and the market direction to move lower.
Stay FullyInformed With Email Updates
Market Direction Internal Links
Profiting From Understanding Market Direction (Articles Index)
Understanding Short-Term Signals
Market Direction Portfolio Trades (Members)