
For Wednesday I had expected the market to stall, turn sideways and struggle to hold the present gains. Stocks were already trending more sideways than up when news started to come through of a possible “terrorist” attack in the Canadian Capital City of Ottawa. Within a few minutes news then flooded in that a soldier appeared to have been shot and gun-shots were being heard in the Canadian Parliament Buildings.
SPX Market Direction Intraday for Oct 22 2014
The intraday chart below shows the market direction set for one minute on Wednesday. The market was pushing toward the 1950 level late in the morning when news started to arrive about the shootings in Ottawa, Canada. The use of the word “terrorists” caught the attention of investors. The market began to decline when news of possibly two gunmen being involved hit the media. This was followed about half an hour later by news that there were possibly as many as 3 gunmen and shots could be heard coming from Canada’s Parliament Buildings. With the afternoon filled with rumors and the media filled with images of police cars and officers rushing to the core of Ottawa, interviews with tourists and bystanders started to hit the media outlets. The reports of a soldier being killed also unnerved some investors and the SPX fell for the remainder of the day.
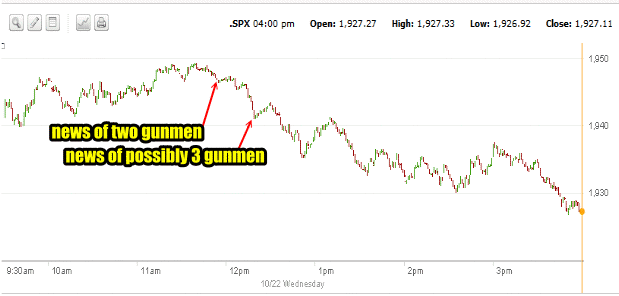
SPX Intraday one minute chart for Oct 22 2014
Advance Declines For Oct 22 2014
Volume fell back by about 300 million shares today with 3.76 billion shares traded, with the majority being traded from the lunch hour into the close. New highs though came in at 91, rising from 65 on Tuesday. Down volume made up 78% of all volume traded.
Market Direction Closings For Oct 22 2014
The S&P closed at 1927.11 down 14.17. The Dow closed at 16,461.32 down 153.49. The NASDAQ closed at 4382.85 down 36.63
The Russell 2000 IWM ETF closed down $1.58 at $108.95 but still above the important $108 threshold.
Market Direction Technical Indicators At The Close of Oct 22 2014
Let’s review the market direction technical indicators at the close of Oct 22 2014 on the S&P 500 and view the market direction outlook for Oct 23 2014.
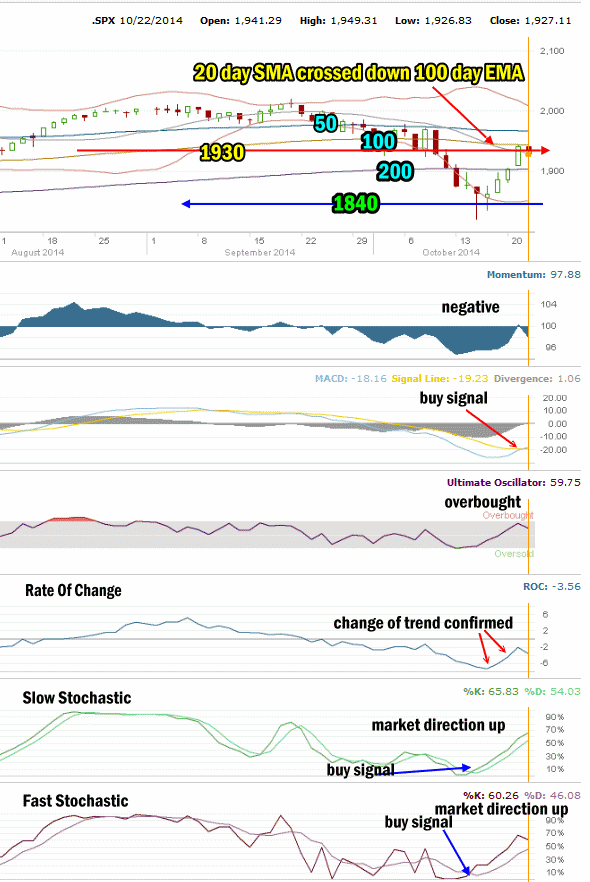
Market Direction Technical Analysis for Oct 22 2014
Stock Chart Comments: Stocks pulled back from the 100 day EMA today but managed to still close just below it. However stocks did close below the important 1930 technical barrier. The 20 day SMA has not moved further below the 100 day EMA which is a good sign at this point in the recovery rally although it was disappointing to see the 1930 level of support break easily in the afternoon selling.
Strong Support Levels are at 1870 and 1840. Both levels are strong enough to delay the market falling. 1930 was given up today. 1956 is also resistance for stocks.
The other two support levels not shown in the chart above are 1775 and 1750. I have explained that these two are critical support for the present bull market. While 1775 is important it is 1750 that is now the bottom line.
A break of 1750 would mark a severe correction of more than 13% from the most recent high. This would be the biggest correction since April 2012. A pull-back of that size would definitely stun investors at this point and it is not something I am anticipating at this time.
Momentum: For Momentum I am using the 10 period. Momentum has been the best indicator, replacing MACD as the most accurate indicator. Momentum has turned positive and with today’s selling turned back negative..
MACD Histogram: For MACD Histogram, I am using the Fast Points set at 13, Slow Points at 26 and Smoothing at 9. MACD (Moving Averages Convergence / Divergence) issued a sell signal on Sept 10. MACD is now positive and issued a buy signal today at the close. We need to see this buy signal confirmed tomorrow for it to take effect.
Ultimate Oscillator: The Ultimate Oscillator settings are: Period 1 is 5, Period 2 is 10, Period 3 is 15, Factor 1 is 4, Factor 2 is 2 and Factor 3 is 1. These are not the default settings but are the settings I use with the S&P 500 chart set for 1 to 3 months. The Ultimate Oscillator is positive and overbought.
Rate of Change: Rate Of Change is set for a 21 period. Today the rate of change is still oversold but is turning up. The change of trend signal remains in place and is continuing to support a change in trend to up, signal.
Slow Stochastic: For the Slow Stochastic I use the K period of 14 and D period of 3. As the Slow Stochastic tries to predict the market direction further out than just one day. The Slow Stochastic is signaling market direction is up and it had issued a buy signal on Wednesday of last week.
Fast Stochastic: For the Fast Stochastic I use the K period of 20 and D period of 5. These are not default settings but settings I set for the 1 to 3 month S&P 500 chart when it is set for daily. The Fast Stochastic is still signaling up and it too had a buy signal on Wednesday of last week.
Market Direction Outlook And Strategy for Oct 23 2014
The media attention on the shootings in Ottawa and the continual coverage of sirens, panic, police and gunfire unnerved a lot of investors. Canada’s capital is not the kind of location where this is ever anticipated as even a possibility. This was the main culprit behind the selling today. Many sellers used the media coverage as a reason to take profits and move to the sidelines.
The market itself is overbought after a sharp run-up. The last bit of news that helped to convince investors to unload some positions was the rise again of the US dollar today and the decline in oil prices to a new low of $80.52 a barrel which is the lowest level since June 28 2012.
Much of the technical data tonight though was skewed by the Ottawa shootings which dominated the attention of investors. This kind of media event is often recovered within a day or two. I am expecting to see stocks recover on Thursday although there could be more selling in the start of the morning.
While it was unfortunate that stocks fell back to below 1930 on the S&P the market direction rally higher still is holding more than 50% recovery of the lost rally and that remains the key to knowing whether this rally is just a big rebound “fake-out” that could snare a lot of investors, or is indeed the real thing.
We will know a lot more shortly but for now Thursday should see some selling in the morning and then a re-start of the rally and push to the upside.
Stay FullyInformed With Email Updates
Market Direction Internal Links
Profiting From Understanding Market Direction (Articles Index)
Understanding Short-Term Signals
Market Direction Portfolio Trades (Members)