
The Market Direction Outlook for Monday was for stocks to be weak in the morning and then move higher in the afternoon. Instead the market hung on into most of the day but then sold off into the close. It was disappointing to see but for most investors, there are jitters when the market cannot move higher. This is yet another day where there is no follow through to the previous day rally. This has become a “habit” since the start of the year.
Advance Decline for Mar 23 2015
Volume on Monday fell back to 3.2 billion shares a drop of over a billion shares. New highs though came in at 226 with new lows in at 18. Up volume was 60%. Earlier in the day until the noon hour, the market was on track for better volume numbers and for more volume to the upside. The late day sell-off jumped the down volume to 39%.
Market Direction Closings For Mar 23 2015
The S&P closed at 2,104.42 down 3.68. The Dow closed at 18,116.04 down 11.61. The NASDAQ closed at 5,010.97 down 15.44.
Market Direction Technical Indicators At The Close of Mar 23 2015
Let’s review the market direction technical indicators at the close of Mar 23 2015 on the S&P 500 and view the market direction outlook for Mar 24 2015.
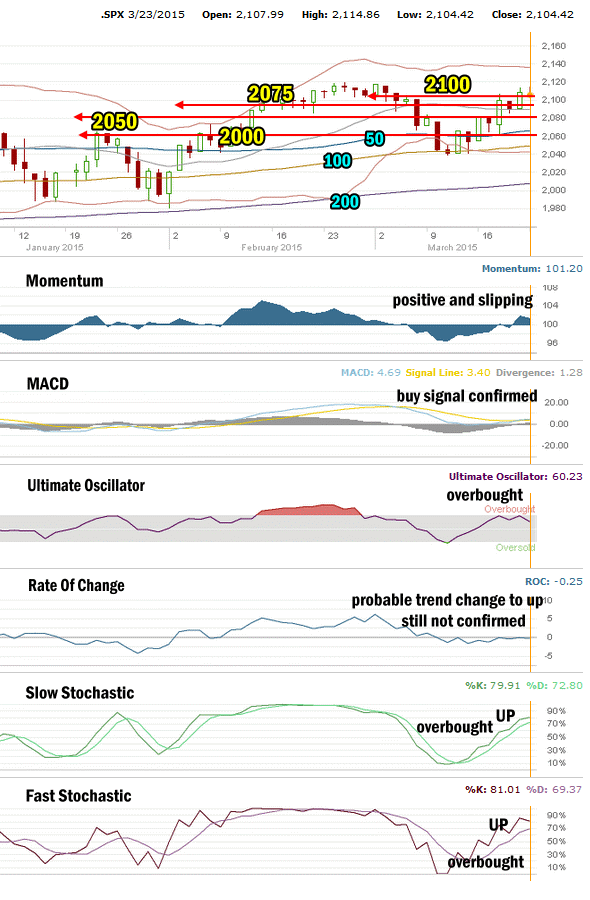
Market Direction Technical Analysis for Mar 23 2015
Stock Chart Comments:
I explained yesterday that stocks would have a bit of trouble at the 2100 level. This has been resistance for some time and as such the market is probably going to retest the 2100 at some point this week. Today the market got down to 2104.42 at the close which could be setting up for a test of 2100 as soon as Tuesday. In my opinion it will be a buying opportunity.
Support and Resistance Levels:
These are the present support and resistance levels.
2100 was very light support and is now resistance. 2075 is light support. Below that is 2050 which is also light support. Stronger support is at 2000 which has repeatedly held the market up throughout each recent pullback.
Weak support is at 1970. Stronger support is at 1956.
1870 and 1840 are both levels with strong enough support to delay the market falling and should see a sideways action attempt while investors decide whether to sell or buy.
The other two support levels are 1775 and 1750. I have explained that these two are critical support for the present bull market. While 1775 is important it is 1750 that is the bottom line.
A break of 1750 would mark a severe correction from the most recent high. This would be the biggest correction since April 2012. A pull-back of that size would definitely stun investors.
Momentum: For Momentum I am using the 10 period. Momentum is positive and slipped back a bit today.
MACD Histogram: For MACD Histogram, I am using the Fast Points set at 13, Slow Points at 26 and Smoothing at 9. MACD (Moving Averages Convergence / Divergence) issued a buy signal on Friday March 20 which was confirmed today by a higher positive reading.
Ultimate Oscillator: The Ultimate Oscillator settings are: Period 1 is 5, Period 2 is 10, Period 3 is 15, Factor 1 is 4, Factor 2 is 2 and Factor 3 is 1. These are not the default settings but are the settings I use with the S&P 500 chart set for 1 to 3 months. The Ultimate Oscillator is overbought. It can stay overbought for days when a rally has strength. We will have to keep an eye on the Ultimate Oscillator for any signals of trouble with the present uptrend.
Rate of Change: Rate Of Change is set for a 21 period. The Rate Of Change is pointing to a change in trend back to up but the Rate Of Change is tending to move more sideways then up and needs to turn up to confirm that this rally higher has quite a bit more to go, otherwise this could be a short rally. Still today there is no confirmation from the Rate Of Change to an uptrend just as there is no signal to the downside either.
Slow Stochastic: For the Slow Stochastic I use the K period of 14 and D period of 3. The Slow Stochastic tries to predict the market direction further out than just one day. The Slow Stochastic is signaling up for stocks and is overbought but there is still plenty of room to the upside.
Fast Stochastic: For the Fast Stochastic I use the K period of 20 and D period of 5. These are not default settings but settings I set for the 1 to 3 month S&P 500 chart when it is set for daily. The Fast Stochastic is signaling up for stocks and it too is overbought but again, there is a lot of room to the upside still before it is extremely overbought.
Market Direction Outlook for Mar 24 2015
The drop into the close is probably setting the market up for a pop higher at the outset on Tuesday and then more selling down to 2100. That’s the level to be watching. I am expecting a kind of see-saw day on Tuesday but as long as the market closes around the 2100 level I have no concerns.
The outlook remains up for the index at the present time.
Stay FullyInformed With Email Updates
Market Direction Internal Links
Profiting From Understanding Market Direction (Articles Index)
Understanding Short-Term Signals
Market Direction Portfolio Trades (Members)