
The market looked like it was trying to hold the recent sell-off in check today. Beneath the numbers though there were wild whipsaws in technology, consumer, health-care, industrial and energy stocks. Raw-material companies on the other hand rallied as the dollar moved lower. During the early morning the VIX reached the highest reading in 5 months at 28.31 before closing at 26.54. Overall the market remains torn between those investors who think the market has further to fall and those that think stocks are bargains already. Meanwhile investors were also waiting today to hear Fed Chair Janet Yellen on Wednesday, “just in case” she says something that moves the market one way or the other.
Index Closing Prices
The indexes closed with only slight losses by the end of the whipsaw day. The S&P closed at 1852.21 down 1.23. The Dow Jones closed at 16,014.38 down 12.67. The NASDAQ closed at 4,268.76 down 14.99.
Advance Decline Numbers
Volume on Monday was again high at 5.2 billion shares. By the close, 65% of all volume was moving to the downside. New lows rose slightly to 481 and new highs were steady at 69.
Market Direction Technical Indicators At The Close
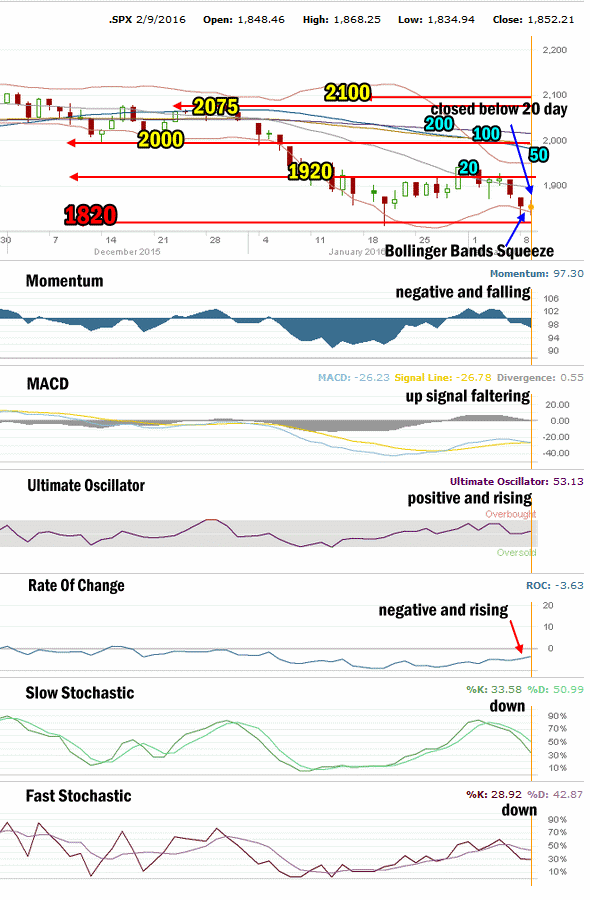
SPX Market Direction Technical Analysis for Feb 9 2016
Stock Chart Comments:
The S&P closed below the 20 day simple moving average (SMA) again on Tuesday. The 50 day is continuing to fall away from the 100 day leaving the market with a strong sell signal as the 200 day leads the market presently. The Bollinger Bands Squeeze is continuing and is now looking more that it may end with the S&P falling.
The closing candlestick is mixed for Wednesday although often this candlestick can signal a move up. The S&P did not fall as far as it did on Monday which is a good sign for the bulls. However every rally during the day was sold into which is a good sign for the bears. Overall a very see-saw day but the index managed to close above the 1850 valuation level which is a good sign.
Support and Resistance Levels:
These are the present support and resistance levels. These levels have not changed since January 2015. 2100 is resistance.
2075 was light support and is also resistance. Below that is 2050 which was also light support and now resistance.
Stronger support was at 2000 which is now resistance.
Weak resistance is at 1970 while stronger resistance is at 1956 and technically it is more important than 1970 for the market. 1940 was light support and was retaken on Friday and reached again today. 1920 was light support and is back as resistance. 1900 is more symbolic than anything else.
1870 is resistance. 1840 continues to be support. The 1820 level is light support but again held up well in the sell-off of the last two weeks.
1775 and 1750 are both critical support for the present bull market. While 1775 is important it is 1750 that is the bottom line.
A break of 1750 would mark a severe correction from the all-time high of 2134.72. This would be the biggest correction since 2011 plunge of 271 points for a 20% pullback. A pullback to 1750 from the all-time high would be a drop of 384 points for a decline of 18%. A pull-back of that size would definitely stun investors and bring to question whether the bull market is finished.
Momentum: For momentum I use a 10 period when studying market direction. Momentum is negative and falling.
MACD Histogram: For MACD Histogram, I am using the Fast Points set at 13, Slow Points at 26 and Smoothing at 9. MACD (Moving Averages Convergence / Divergence) issued a buy signal on Jan 28. The buy signal is faltering and could turn to a sell signal shortly.
Ultimate Oscillator: The Ultimate Oscillator settings are: Period 1 is 5, Period 2 is 10, Period 3 is 15, Factor 1 is 4, Factor 2 is 2 and Factor 3 is 1. These are not the default settings but are the settings I use with the S&P 500 chart set for 1 to 3 months. The Ultimate Oscillator is back positive and rising.
Rate of Change: Rate Of Change is set for a 21 period. The rate of change signal is negative and back moving sideways. The reading at the close was negative 3.63 up slightly from Monday’s close and while not significant, it could be signaling the market will try to recover.
Slow Stochastic: For the Slow Stochastic I use the K period of 14 and D period of 3. The Slow Stochastic tries to predict the market direction further out than just one day. The Slow Stochastic is signaling down for stocks.
Fast Stochastic: For the Fast Stochastic I use the K period of 20 and D period of 5. These are not default settings but settings I set for the 1 to 3 month S&P 500 chart when it is set for daily. The Fast Stochastic is pointing down for stocks.
Market Direction Outlook for Feb 10 2016
Technically the S&P has 4 negative signals but none of them are gathering any more strength aside from momentum. There are now 2 positive signals although the MACD indicator is ready to issue a sell signal on Wednesday.
While there are signs that a rebound rally may be in the works, the overall bias remains lower. Therefore if there is a rally attempt on Wednesday is should be used to sell for profits in my opinion. Once sold, the capital should be held outside the market waiting for another move to the 1820 to 1812 level before taking positions on stocks.
Any rebound rally still looks like it will fail as the general Market Direction Outlook for Wednesday remains lower. The Fed though could change the direction depending on what Chair Janet Yellen might say on Wednesday. A hint of a delay in rate hikes should send stocks back up. While it most likely would be temporary, a rally at this point would assist stocks in trying to stabilize.
Stay FullyInformed With Email Updates
Market Direction Internal Links
Profiting From Understanding Market Direction (Articles Index)
Understanding Short-Term Signals
Market Direction Portfolio Trades (Members)
Market Direction External Links
IWM ETF Russell 2000 Fund Info
Market Direction SPY ETF 500 Fund Info