
The market direction outlook for Friday Dec 27 was for the market to be weak but end with a positive close. The weakness however held for the entire day although there was an effort at the end to almost get a positive close. Stocks are very overbought at this point but that still does not mean there is not more upside still ahead. Let’s take a look at Friday’s action to start our market direction outlook for final week of 2013 and start of a brand new year.
Market Direction S&P 500 Intraday For Dec 27 2013
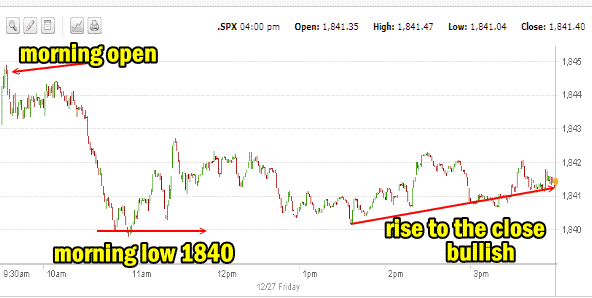
On Friday the market opened with a short little jump and by 10:00 AM the marked pulled back to just around 1840. This was a good sign as 1840 is right around the highest low from Thursday’s market in which we saw the S&P climb steadily all afternoon. With 1840 holding investors basically traded away much of Friday. The early afternoon saw the market begin a rise which eventually saw the S&P 500 push to just above Thursday’s close and then pull back to close down less than a point. The problem on Friday was market volume which was low and the overbought nature of the market.
Santa Stats From The Past
It is pretty common for the market to have trouble at the end of the year and then move higher at the start of the new year.
2009 Year End
For example in 2009 December 29, 30, 31 were all lower and then the market direction jump higher on the first trading day of January 2010 and moved higher before selling off later in the month.
2010 Year End
In 2010 Dec 30 and 31 saw the market direction move lower and then on the first trading day of 2011, Jan 3, the market took a big jump higher.
2011 Year End
In 2011, December 27, 28, 29 and 30 trended sideways with an up down fashion that went nowhere. Then on Jan 3, the first trading day of 2012 the market direction jumped higher and stocks rallied strongly into January.
2012 Year End
In 2012, December 28, 29 and 30 saw the market direction turn lower, but on December 31 the market shot back up and on January 2, 2013 the market took a big jump and commenced a rally that is still underway at present.
Much of the problem for the year-end rally is that stocks in all the above years had already rallied fairly hard before the final days of the month and as such stocks were very oversold. A few days of sideways and down action is all it took to bring in more capital and investors pushed the S&P higher in each new year.
Advance Declines For Dec 27 2013
Friday was pretty well a draw between advancing and declining issues. 50% of stocks declined and 47% advanced. Once again though there were more new highs and fewer new lows. On Friday there were 253 new highs and just 87 new lows. While volume was pretty well equal, the bulls are still definitely in charge.
Market Direction Closings For Dec 27 2013
The S&P closed at 1841.40 down just 0.62. The Dow closed at 16,478.41 down just 1.47. The NASDAQ closed at 4156.59 down 10.59.
The IWM ETF closed at 115.16 down 7 cents.
All the market direction closings for Friday are bullish. None of the indexes are giving back the recent gains made which considering there is not a lot of support at present levels, is a good sign that the market direction will be moving higher soon.
Market Direction Technical Indicators At The Close of Dec 27 2013
Let’s review the market direction technical indicators at the close of Dec 27 2013 on the S&P 500 and view the market direction outlook for Dec 30 2013.
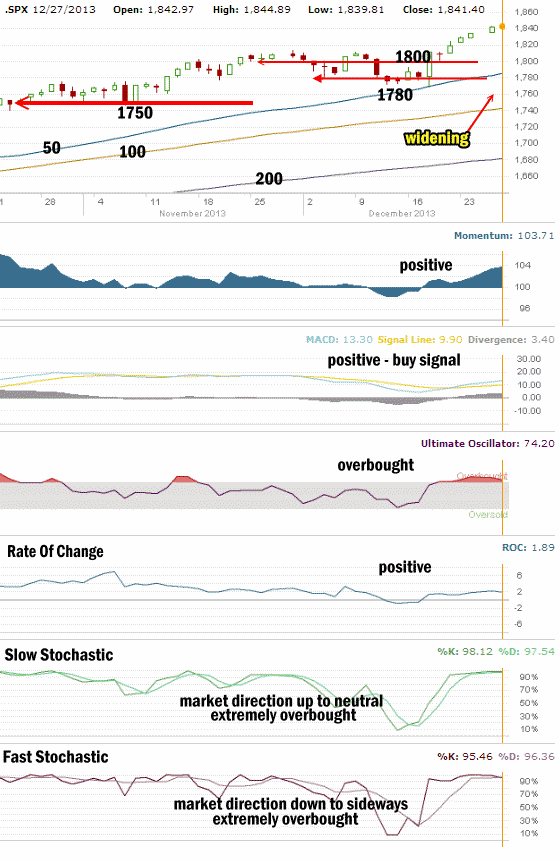
The most important support line in the S&P 500 at this time remains at 1750. That support line is holding the market direction up at present and that has not changed. The second support level of 1780 is very light support followed by another band of light support at 1800. The 50 day simple moving average (SMA) is widening as it moves away from the 100 day exponential moving average (EMA). This is showing investors that the push higher is strong and being bought heavily into by investors. It is rare when the 50 day SMA pulls much further away from the 100 day without a few days of rest where the moving averages become closer again. We could therefore see some more sideways action in the market direction.
For Momentum I am using the 10 period. Momentum has been the best indicator during this recent correction. Momentum is positive and continues to move higher.
For MACD Histogram I am using the Fast Points set at 13, Slow Points at 26 and Smoothing at 9. MACD (Moving Averages Convergence / Divergence) issued a buy signal on Dec 23. That buy signal was strong and has been confirmed. On Friday the MACD moved higher signaling more upside lies ahead for stocks.
The Ultimate Oscillator settings are Period 1 is 5, Period 2 is 10, Period 3 is 15, Factor 1 is 4, Factor 2 is 2 and Factor 3 is 1. These are not the default settings but are the settings I use with the S&P 500 chart set for 1 to 3 months.
The Ultimate Oscillator is overbought for the sixth trading day.
Rate Of Change is set for a 21 period. The Rate Of Change is positive for the sixth day and continues to show strength.
For the Slow Stochastic I use the K period of 14 and D period of 3. The Slow Stochastic continues to turn flat and while still pointing up the signal is closer to neutral than up. The Slow Stochastic is extremely overbought. The %D readings have risen dramatically and continue to stay very close now to the %K readings which is often followed by weakness in stocks as the condition is very overbought.
For the Fast Stochastic I use the K period of 20 and D period of 5. These are not default settings but settings I set for the 1 to 3 month S&P 500 chart when it is set for daily. The Fast Stochastic signals are pointing to sideways with a bias to the downside for Monday. The signals are very similar to the Slow Stochastic at this point, reflecting the strong overbought condition of stocks.
Market Direction Outlook And Strategy for Dec 30 2013
The market direction technical indicators are somewhat mixed on Friday. Strength still lies to the upside for stocks, but as in the past years, the final days of the year often see weakness as stocks are so often overbought at this time of year.
For Monday then it looks like stocks may turn in a weak performance although I still think there is more upside than downside at present. Therefore we could see more sideways with a slight bias to weakness for most of the morning and then a push higher for the afternoon.
Any weakness in my favorite stocks is a signal to sell puts and prepare for more upside. I believe stocks could be weak on Monday and begin a recovery late in the day. If that is the case then the morning will be the best time for selling puts if stocks exhibit weakness. I will place a list of some of the trades I am considering for Monday in the members section later this evening.
Market Direction Internal Links
Profiting From Understanding Market Direction (Articles Index)
Understanding Short-Term Signals
Market Direction Portfolio Trades (Members)
Market Direction External Links
Market Direction IWM ETF Russell 2000 Fund Info
Market Direction SPY ETF 500 Fund Info