Monday’s market direction outlook pointed to further sideways action with a bias toward the market direction trying to push higher. That ended quickly when Chicago Fed president Charles Evans, commented on the possibility of a scaling back of Quantitative Easing by September. This roller coaster approach to managing Fed policy seems to point to “too many cooks in the kitchen”.
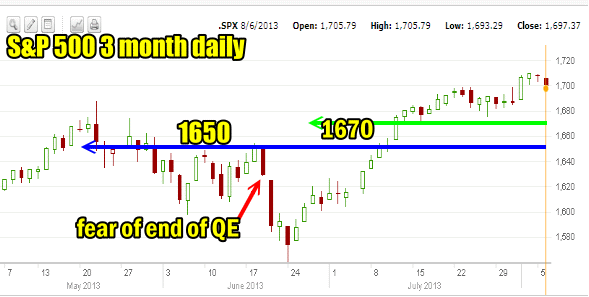
If you look at the 3 month S&P 500 chart below you can see that when Bernanke commented on the possibility of Quantitative Easing being scaled back the market collapsed. Within days Bernanke did an about-face and indicated that the likelihood of an early easing was remote. The market quickly recovered and pushed beyond 1650 and then 1670. Now we are back to talk about possible scaling back Quantitative Easing and the market direction is pulling back.
Statistics For August Show Weakness
According to the Trader’s Almanac August is the worst month of the year on average since 1987. It has been the worst month for the Dow, S&P 500 and NASDAQ indexes and in 1998 it contained the shortest bear market in history which was caused by turmoil in Russia, the Russian currency crisis and a hedge fund debacle which resulted in a 1344.22 point drop in the Dow. In 1990 Saddam Hussein triggered a 10% slide in the Dow. Over the past 15 years the S&P 500 was up just twice.
The first 9 trading days of August are historically weak over that same period of time. If this is the case then there may be some terrific Put Selling opportunities coming up!
S&P 500 Chart And Support
In my market direction comments over the past two weeks I have pinpointed two lines of support in the S&P 500. The first is 1670 at which point I will be buying Spy Put Options and Ultra Short ETFs and will most likely hold them to see if the S&P falls below 1650. If 1650 breaks I would expect the S&P market direction to turn down and push back toward the lows of June.
Market Direction Closing For Aug 6 2013
The S&P 500 closed at 1,697.37 down 9.77. The Dow closed at 15,518.75 down 93.39. The NASDAQ closed at 3,665.77 down 27.18.
Market Direction Technical Indicators At The Close of Aug 6 2013
Let’s review the market direction technical indicators at the close of Aug 6 2013 on the S&P 500 and view the market direction outlook for Aug 7 2013.
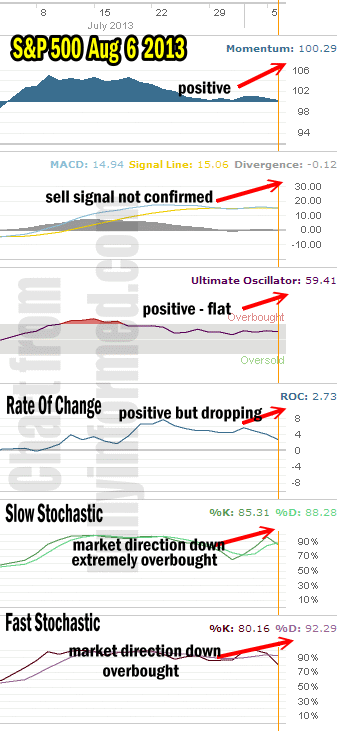
For Momentum I am using the 10 period. Momentum is essentially flat still flat but another down day and it will turn negative. The flat momentum shows that a lot of investors are still convinced the market direction is up not down. They are holding on and a few are still even buying on the present weakness.
For MACD Histogram I am using the Fast Points set at 13, Slow Points at 26 and Smoothing at 9. MACD (Moving Averages Convergence / Divergence) issued a weak sell signal on July 31 which was not followed by a confirmation of that sell signal. Today MACD turned negative again. The signal is not high enough to confirm July 31 sell signal but for those investors who like to gamble, buying a handful of put options or an ultra short ETF does have some merit particularly when you consider the August statistics. For myself I want a clearer signal that the direction up is over.
The Ultimate Oscillator settings are Period 1 is 5, Period 2 is 10, Period 3 is 15, Factor 1 is 4, Factor 2 is 2 and Factor 3 is 1. These are not the default settings but are the settings I use with the S&P 500 chart set for 1 to 3 months.
The Ultimate Oscillator is still positive but flat which considering the drop during the day in the S&P the Ultimate Oscillator should be lower if there was a lot of selling pressure in the market direction.
Rate Of Change is set for a 21 period. The rate of change is positive but it is dropping today which shows that investors are increasingly cautious and some are moving to the sidelines.
For the Slow Stochastic I use the K period of 14 and D period of 3. The Slow Stochastic is signaling that the market direction has changed from up to down. The Fed President’s comments hit the market hard and the slow stochastic is signaling that by the week’s end the market direction may be lower.
For the Fast Stochastic I use the K period of 20 and D period of 5. These are not default settings but settings I set for the 1 to 3 month S&P 500 chart when it is set for daily. The Fast Stochastic is indicating that the market direction is down for tomorrow.
Market Direction Outlook And Strategy for Aug 7 2013
The weakness over the past two days is impacting the market timing technical indicators. The fast stochastic is signaling that the market direction is lower for tomorrow and the slow stochastic is signaling that it will be lower by the end of the week. While I will not yet be buying Spy Put Options put options, I will be trading the Trading For Pennies Strategy on the IWM ETF to the downside.
Meanwhile MACD is the technical indicator I will be watching tomorrow. Even if the market direction churns sideways or up on Wednesday but MACD moves lower it will confirm the sell signal of July 31.
The market direction technical indicators are still predominantly positive but market direction is often controlled through emotion and the fear of the end or a scaling back of Quantitative Easing could be enough catalyst to put in place a top for the rest of the summer.
I still remain looking for Put Selling opportunities and until 1670 is breached by the market direction moving lower I remain with my strategy of Put Selling, committing my capital to trades and will remain long the market direction portfolio.
There is a lot of strength still in the market and many traders will be watching the next several days to see if trading opportunities arise out of investor fears. That said it never hurts to stay cautious because if this August follows the same history books as the past ones, then obviously there will be better Put Selling opportunities coming up shortly.
Meanwhile the Fed roller coaster policy continues to baffle investors. For tomorrow I am expecting the roller coast to continue. The outlook is still more sideways than up or down and Tuesday’s pullback might just be enough for some investors to jump in and push stocks up even slightly. Overall though the market direction could probably end up higher or lower tomorrow but the bias now seems for the market direction to be lower, even if only slightly.
Market Direction Internal Links
Profiting From Understanding Market Direction (Articles Index)
Understanding Short-Term Signals
Market Direction Portfolio Trades (Members)
Market Direction External Links
Market Direction IWM ETF Russell 2000 Fund Info
Market Direction SPY ETF 500 Fund Info


