
The market direction outlook for Monday Nov 10 was for stocks to remain mixed with some possible morning weakness. The outlook called for stocks to have either a positive or slightly negative close. Overall the market direction outlook was for the overbought condition of the market to move stocks sideways. Often this type of movement can lead to consolidation of stocks. This consolidation can see periods of dips as well but eventually stocks move higher.
US Dollar Rising
In the morning the US dollar was not rising but within a few hours the dollar began to climb again, especially after economic reports out of China showed the trade surplus as wider than expected at $45.4 billion demonstrating that the Chinese economy is still expanding although not at double-digit rates. This led analysts to comment that perhaps global growth was not going to be as bad as expected and the US dollar seemed to bounce off this Chinese data. It rose further which actually seemed to pressure stocks somewhat. The day ended with stocks ahead slightly.
Advance Declines For Nov 10 2014
The advance decline ratio is continuing to become more mixed with 51% of volume rising and 48% declining. Volume dropped back to 3.3 billion shares on Monday. There were 183 new highs and just 28 new lows. This supports the theory that stocks may try to consolidate at present levels and then move higher.
Market Direction Closings For Nov 10 2014
The S&P closed at 2038.26 up 6.34. The Dow closed at 17,613.74 up 39.81. The NASDAQ closed at 4651.62 up 19.08.
The Russell 2000 IWM ETF closed up 58 cents at $117.29 for the best gain among the indexes,, up half a percent.
Market Direction Technical Indicators At The Close of Nov 10 2014
Let’s review the market direction technical indicators at the close of Nov 10 2014 on the S&P 500 and view the market direction outlook for Nov 11 2014.
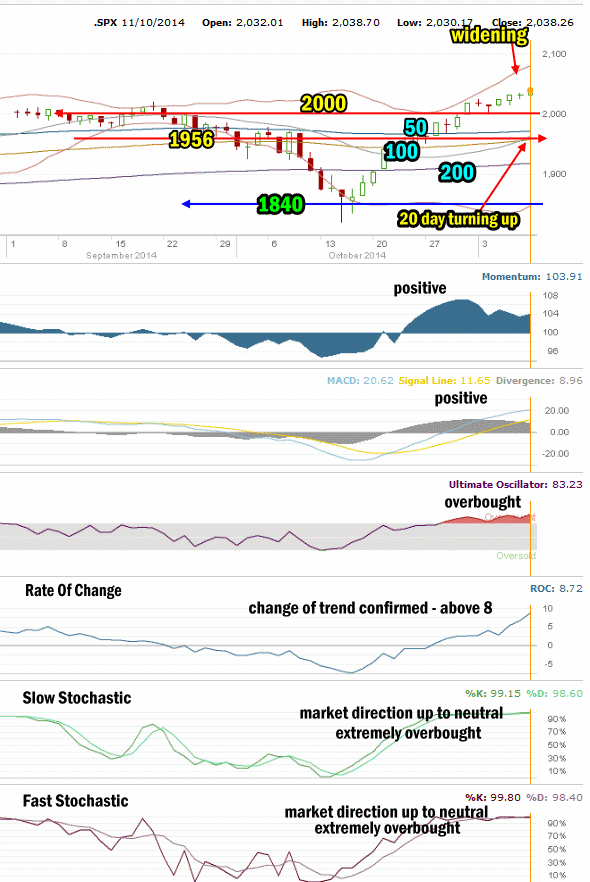
Market Direction Technical Analysis for Nov 10 2014
Stock Chart Comments: Stocks on Monday followed a sideways pattern, staying mixed but keeping a bullish bias. The 20 day simple moving average (SMA) is now turning back up above the 200 day exponential moving average (EMA) signaling higher for stocks. The Upper Bollinger Band is continuing to widen from the Lower Bollinger Band but stocks are not clinging to the Upper Bollinger Band but instead moving slightly higher but staying inside the Lower Bollinger Band and trending more sideways than up.
Strong Support Levels are at 1870 and 1840. Both levels are strong enough to delay the market falling. 1956 and 1970 are back as support for stocks. 2000 is the highest level of support at present and while not strong, it should have enough strength to hold sellers back for at least a day in the event of an interim pullback. I am not expecting this to happen at this stage of the rally. The market direction still looks like it wants to consolidate and then possibly move higher.
The other two support levels not shown in the chart above are 1775 and 1750. I have explained that these two are critical support for the present bull market. While 1775 is important it is 1750 that is now the bottom line.
A break of 1750 would mark a severe correction of more than 13% from the most recent high. This would be the biggest correction since April 2012. A pull-back of that size would definitely stun investors at this point and it is not something I am anticipating at this time.
Momentum: For Momentum I am using the 10 period. Momentum is still positive.
MACD Histogram: For MACD Histogram, I am using the Fast Points set at 13, Slow Points at 26 and Smoothing at 9. MACD (Moving Averages Convergence / Divergence) issued a buy signal on October 22. MACD is continuing to gain strength.
Ultimate Oscillator: The Ultimate Oscillator settings are: Period 1 is 5, Period 2 is 10, Period 3 is 15, Factor 1 is 4, Factor 2 is 2 and Factor 3 is 1. These are not the default settings but are the settings I use with the S&P 500 chart set for 1 to 3 months. The Ultimate Oscillator is positive and remains extremely overbought..
Rate of Change: Rate Of Change is set for a 21 period. The rate of change is staying positive and confirming the trend change to up and on Friday it broke through to a reading of 8.72 today which indicates strength to the upside but also if it continues to rise much more will begin to indicate a shift back to down for stocks. This bears watching.
Slow Stochastic: For the Slow Stochastic I use the K period of 14 and D period of 3. As the Slow Stochastic tries to predict the market direction further out than just one day. The Slow Stochastic is signaling market direction is up to neutral and it is extremely overbought.
Fast Stochastic: For the Fast Stochastic I use the K period of 20 and D period of 5. These are not default settings but settings I set for the 1 to 3 month S&P 500 chart when it is set for daily. The Fast Stochastic is signaling up to neutral for stocks and is extremely overbought.
Market Direction Outlook And Strategy for Nov 11 2014
The outlook for Tuesday is for stocks to continue to try to consolidate but keep the upward bias. We could see a small gain by the close but the technical indicators are more bullish than that, which could mean a larger move higher is coming.
Meanwhile the mixed or sideways pattern is obvious when we look at the Fast Stochastic and Slow Stochastic which are both signaling up to neutral for stocks.
For Tuesday then look for some trade possibilities during the first 30 to 60 minutes and then a possible sideways pattern into the lunch hour. The close should see stocks move higher even if just slightly.
Stay FullyInformed With Email Updates
Market Direction Internal Links
Profiting From Understanding Market Direction (Articles Index)
Understanding Short-Term Signals
Market Direction Portfolio Trades (Members)