One of the most interesting contrarian-type investors has to be Marc Faber. In an interview last week in Finanzen 100, a German internet portal Faber explained that he believes with all the money printing going on by the central banks that the next bubble that burst will mean an end to the capitalist economic system as we know it. Actually his exact words were “the next time a bubble bursts, then the capitalist economic system as we know will falter.”
In fairness then, this could actually be taken a number of different ways. Faber though is definitely a perma-bear. Although in early 2007 he predicted a major collapse in stocks he changed in May 2007 and indicated that US Stocks were not overvalued. Many other analysts made the same mistake throughout 2007 and into the first half of 2008 indicating repeatedly that the correction in stocks was over.
Although now Faber explains that he predicted the rise of stocks in 2011 and 2012, he was actually repeatedly a bear since the collapse of stocks in 2008 and has missed one of the greatest rallies stocks have experienced in decades.
That’s the problem with trying to predict events that have not yet happened. Just as Nouriel Roubini has discovered, being right once or twice does not constitute that you will be right always.
Argument Against?
I actually see no point in arguing against Faber’s or anyone’s outlook. Faber has been bearish through some of the best times in stocks and in commodities.
Rather than even arguing I think it is better to turn down all the noise and focus on where we are and where we may be going. As small investors we have very finite amounts of capital and investing resources available to us. The internet is filled with analysts, companies, websites, and much more trying to tell us which stocks to pick and where to place our capital for profits.
For myself I know where I want to invest my capital but what I like to know is that when I am investing my capital I am not entering the market at a time when stocks are about to collapse leaving me with shocking losses.
Predicting Collapses Is Hard To Do
Predicting collapses in any kind of asset is incredibly hard to do. There are always warning signs no matter what asset you trade in including everything from currencies to oil to stocks to bonds to even real estate, but spotting long-term sell signals can be a tough thing to do. Why analysts like Faber remain permabears is tough to judge let alone understand. By keeping an open mind and staying away from the fringe elements of any investing endeavor we are better able to profit no matter what the markets throw at us.
For example, depending on what time period you followed in 2007, you may have seen the same sell signal I saw in December 2007 when the 200 day exponential moving average (EMA) crossed over and down the 50 day simple moving average (SMA) and the 100 day exponential moving average (EMA). After December 2007, the 200 day EMA was above both the 50 and 100 day moving averages. This inversion in moving averages was a great signal advising investors that the market was in a full blown bear. But when I saw this signal I did not know it was actually a long-term sell signal.
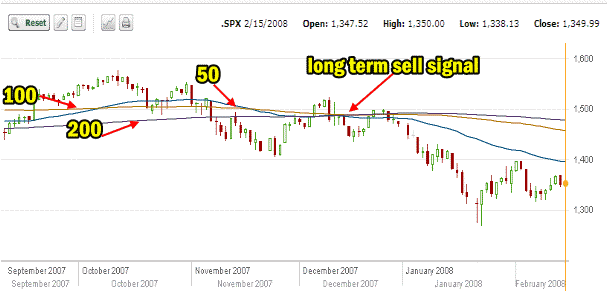
The Weekly S&P 500 Outlook in 2007
But anyone truly paying attention knew stocks were in trouble in the second half of 2007. When we change to weekly for the period from May 2007 to Feb 2008 you can see the classic signs of a market top.
Classic Signs Of A Market Top
The S&P 500 made a new high in July 2007 and then a second higher high in early October 2007. That was the last time that high was seen until just recently in 2013. From that point on the market made declining highs or what is referred to as lower highs. A string of lower highs and lower lows in the market direction tells investors that there is a technical and fundamental problem with stocks. Those who missed the market direction sell signal in December when the 50 and 100 day moving averages collapsed below the 200 day moving average certainly should have spotted the declining highs of 2008.
Momentum Sell Signals
Those who follow momentum probably saw two big signals. The first was the poor momentum which I have marked A, leading up to the rise to the second top. This is typical of a market making a final top. Instead of momentum building as the market direction pushes higher, the rise to the second top saw momentum staying to the downside or staying negative. This is a non-confirmation of a top and while technical in nature, it is extremely typical of every market top I have seen since 1973.
The second signal was momentum growing to the downside after a new high, which I have marked as B in the chart below. You can see in the chart below that as the S&P tried to climb back in December 2007 and again in January 2008, momentum kept building to the downside. This is the signal I saw which told me to close all positions and turn to making profits from to the downside. 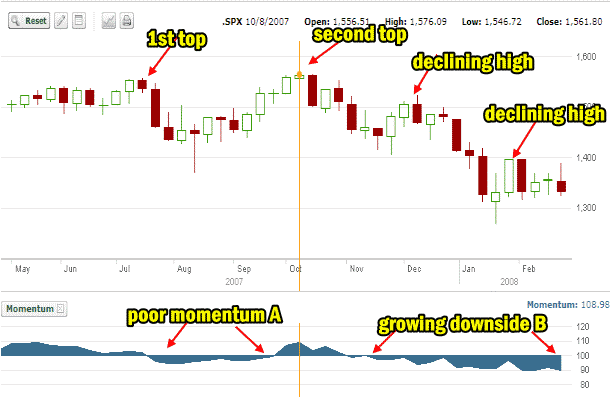
Profiting From A Market Collapse
Therefore while I may not have known in December 2007 that there was a market collapse about to happen, I was able to prepare my portfolio to enjoy profits to the downside. The signals in December 2007 and again in January 2008 with a lower high and declining momentum warned me to buy back naked puts I had sold and to raise cash levels. This also signaled that I should be looking at sell call credit spreads or sell naked calls. It also signaled that on long-term stock holdings I should move to selling in the money covered calls and as the market continued to make lower lows, sell deeper in the money covered calls.
Finally for the first time I also was able to buy the new Ultra-Short ETFs which many investors refer to as bear ETFs. So while it was impossible to determine if this was indeed a long-term sell signal, all the signs were enough to allow me to position my portfolio to profit from the downside of stocks.
Stacking Up Today
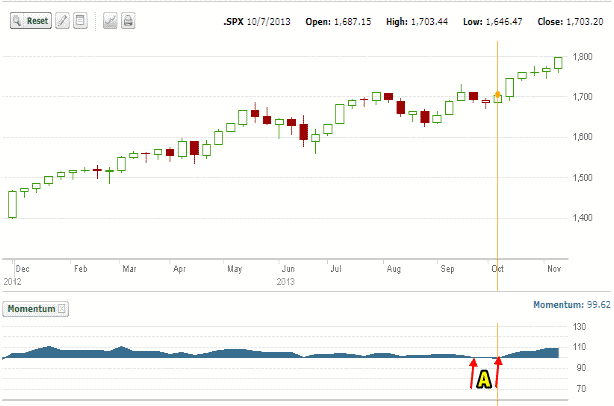
So how does today stack up for these same signals? If we look at the 2013 through the week chart we can see that not only is the market direction continuing to make new highs but only once during this entire period has momentum been negative and for just three weeks. I have marked that period with an A.
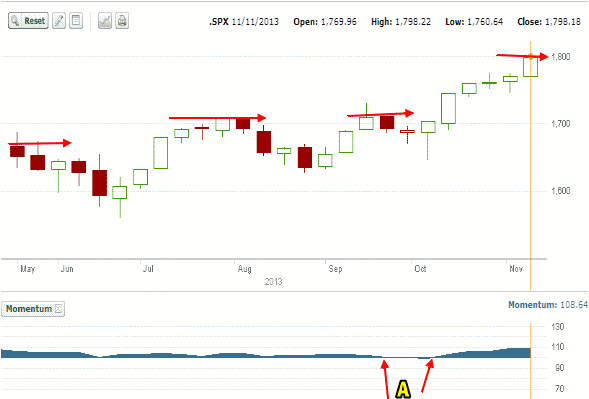
6 Month Weekly Chart
If we look at the 6 month weekly chart the picture is exactly the same. We see a pattern of higher highs and only one short period of 3 weeks when momentum was negative. Indeed at present momentum appears to be back building to the upside in the S&P market direction.
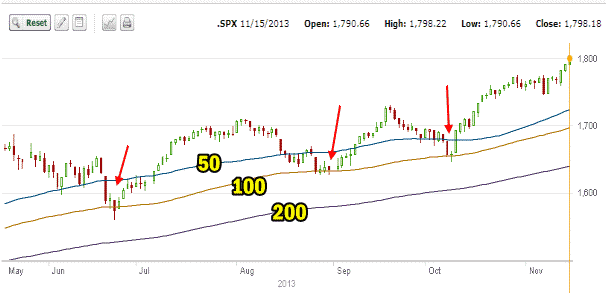
Moving Averages for 2013
Finally if we look at the 6 month daily chart we can see that no once has the 50 day simple moving average (SMA) fallen below the 100 or 200 day exponential moving averages (EMA). In fact only 3 times this year have we seen even a correction in which the 100 day moving average was reached.
Are We In A Bubble?
Are we in a bubble for stocks again? Probably. Is it being driven by liquidity or Quantitative Easing as it is referred to? Most likely. Does it matter to me as a small investor? Not at all. Do I think the end of this bull market means the end of Capitalism as we know it? I doubt that very much.
Why Not Be Paid In Gold?
Faber’s writings and comments focusing on doom and gloom are designed to do only one thing and that is sell subscriptions and get more media attention. If all of these analysts who get rich off of their publicity were do doom and gloom oriented why do they prefer to be paid in US Dollars and not gold bars?
No Time For Doom and Gloom
As a small investor I have no time for doom and gloom. Instead by focusing on my market direction signals I can profit no matter which way the market turns. In fact with the products on the market today, profiting from up and down markets is easier than ever before.
Understanding Bubbles
The more important aspect of all this bubble talk, I believe has to be the understanding by investors that bubbles form continuously in societies whether capitalist or not. There have been bubbles in all kinds of products in everything from toys to tulip bulbs. They come and go, rise and crash, but the more important aspect is to understand that there are bubbles being formed all the time. Bubbles are a part of investing in stocks and in bonds. The important aspect of bubbles for us as investors is watching for the warning signs of when that bubble is about to burst and then acting accordingly to position our portfolios appropriately.
Become A Boy Scout
I have no control over bubbles being created but I do have control over whether I am there profiting from it and protecting my portfolio during it and to me that is the more important aspect of understanding bubbles in stocks.
If I could offer an advice to investors it would be to think of the boy scout motto – “Be Prepared”.
Internal Stock and Option Trades Links
Put Selling Strategies For Members
Covered Calls Strategies For Members
Profit And Income Strategies Index
Stock and Option Strategies For Members
Stock And Option Trades Explained For Members
