
Tuesday saw a drop on all indexes that was almost as deep as the drop on Monday Sep 20. The difference was that the drop on Sep 20 which was 97 points at the low, found buyers later in the day which sent the index back higher which resulted in a loss of 75 points. On Tuesday Sep 28 the drop in the index was near the lows of the day by the close which resulted in a drop of 90 points by the close as buyers stood aside during the last hour of trading. Analysts claim the drop was caused by the rise of Treasury Yield to 1.5% but investors claim they were worried about the debt ceiling crisis and the high risk that the US may default for the first time in their history. Many investors believe the likelihood of this happening is high as politicians remain severely divided. Investors believe a default will drive Treasury Yields higher and send stocks into a tailspin. Whether this happens is anyone’s guess but let’s see what the technical indicators advise after Tuesday’s big drop.
Stock Market Outlook Chart Comments At The Close on Tue Sep 28 2021
On Tuesday, the index fell back to the Lower Bollinger Band and closed just above the 100 day moving average closing at 4353 which is bearish.
The 21 day moving average continues to fall and could cross below the 50 day this week which will be another down signal.
The closing candlestick on Tuesday is bearish for Wednesday but also indicative of a potential bounce after Tuesday’s big sell-off.
The 100 and 200 day moving averages are still climbing which is bullish..
For Wednesday there are more bearish signals than bullish which indicates investors should expect further downside.

Stock Market Outlook review of Tue Sep 28 2021
Stock Market Outlook: Technical Indicators Review:
Momentum: Momentum is falling and staying negative.
- Settings: For momentum I use a 10 period when studying market direction.
MACD Histogram: MACD (Moving Averages Convergence / Divergence) issued a down signal on Thu Sep 9. On Tuesday the down signal almost doubled in strength from Monday’s close.
- Settings: For MACD Histogram, I am using the Fast Points set at 13, Slow Points at 26 and Smoothing at 9.
Ultimate Oscillator: The Ultimate Oscillator is falling and negative.
- Settings: The Ultimate Oscillator settings are: Period 1 is 5, Period 2 is 10, Period 3 is 15, Factor 1 is 4, Factor 2 is 2 and Factor 3 is 1. These are not the default settings but are the settings I use with the S&P 500 chart set for 1 to 3 months.
Slow Stochastic: The Slow Stochastic has an down signal in place.
Settings: For the Slow Stochastic I use the K period of 14 and D period of 3. The Slow Stochastic tries to predict the market direction further out than just one day.
Relative Strength Index: The RSI signal is falling and back into oversold readings.
- Settings: The relative strength index is set for a period of 5 which gives it 5 days of market movement to monitor. It is often the first indicator to show an overbought or oversold signal.
Rate of Change: The rate of change signal is falling sharply.
- Settings: Rate Of Change is set for a 21 period. This indicator looks back 21 days and compares price action from the past to the present. With the Rate Of Change, prices are rising when signals are positive. Conversely, prices are falling when signals are negative. As an advance rises the Rate Of Change signal should also rise higher, otherwise the rally is suspect. A decline should see the Rate Of Change fall into negative signals. The more negative the signals the stronger the decline.
Support and Resistance Levels To Be Aware Of:
4550 is resistance
4525 is resistance
4500 is resistance
4490 is resistance
4475 is light support
4450 is light support
4400 is good support
4370 is good support
4350 is light support
4300 is light support
4290 is light support
4270 is light support
4250 is good support
4225 is light support
4200 is good support
4175 is light support
4150 is light support
4100 is good support
4070 is light support
4050 is light support
4000 is good support
3900 is support
3850 is support
3800 is support
3750 is good support
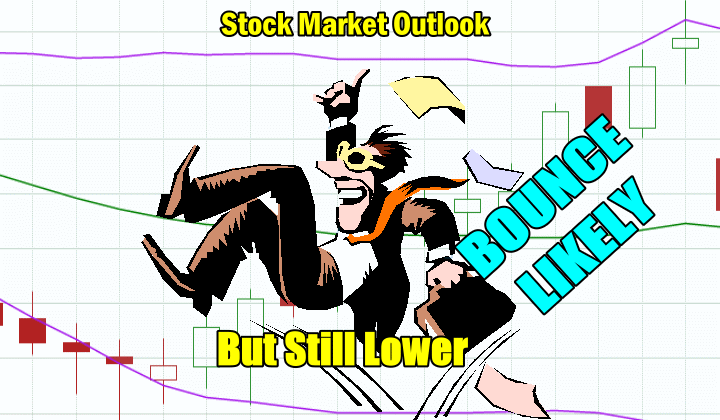
Stock Market Outlook for Tomorrow – Wed Sep 29 2021
On Tuesday there was news from Janet Yellen that the Treasury will “exhaust its extraordinary limits” to October 18 which pushes further out any chance of a default without a debt ceiling resolution. That, and the heavy selling on Tuesday should be enough to get a bounce underway, but the technical signals are advising that the market has a good chance to bounce and then fall lower.
On Tuesday the index closed at 4353, which is at the support level of 4350. The next level of any significant support is at 4300. The 200 day moving average is much lower at the 4125 level.
For Wednesday expect a bounce in the morning but more selling either later in the day or on Thursday. I will be buying SPY put options in the anticipated bounce on Wednesday.
Stock Market Outlook Archives
Stock Market Outlook for Thu Apr 25 2024 – Weakness and Lower

Morning Investing Strategy Notes for Wed Apr 24 2024

Stock Market Outlook for Wed Apr 24 2024 – Some Weakness But Higher Close

Morning Investing Strategy Notes for Tue Apr 23 2024
Stock Market Outlook for Tue Apr 23 2024 – Bounce But Lower

Morning Investing Strategy Notes for Mon Apr 22 2024
Stock Market Outlook for Mon Apr 22 2024 – No Change – Deeply Oversold Bounce Possible

Morning Investing Strategy Notes for Fri Apr 19 2024
Stock Market Outlook for Fri Apr 19 2024 – Deeply Oversold – Bounce Likely – Higher Close

Morning Investing Strategy Notes for Thu Apr 18 2024
Stock Market Outlook for Thu Apr 18 2024 – Deeply Oversold – Bounce Attempt Expected
Morning Investing Strategy Notes for Wed Apr 17 2024
Stock Market Outlook for Wed Apr 17 2024 – Another Bounce Attempt

Morning Investing Strategy Notes for Tue Apr 16 2024
Stock Market Outlook for Tue Apr 16 2024 – Deeply Oversold