
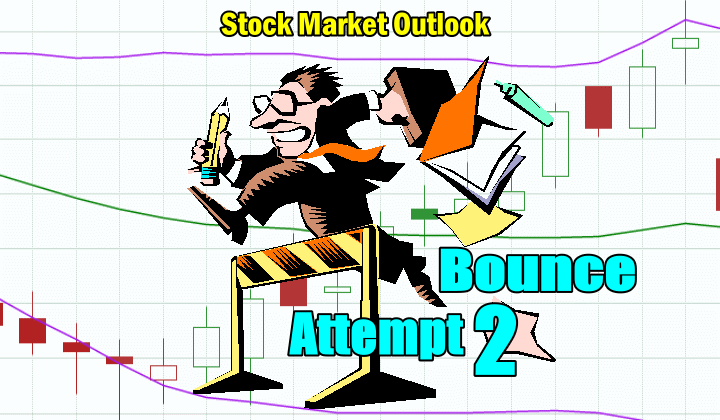
On Friday the SPX struggled in the morning after a spike higher at the open. By 10:30 the index was back down to another new 52 week low of 3636 before buying managed to push the index higher. The afternoon failed to see a large plunge into the close. Instead the SPX closed up 8 points. This should set the index for a second, stronger attempt to push higher on Tuesday.
Volume was very heavy as Friday was triple witching and new highs were just 2, yet the index held up under selling pressure and slashed the number of new 52 week lows by 50% from Thursday. A move of that size normally indicates a bounce is building.
The NASDAQ rose 152 points on Friday closing at 10,798. Thursday saw a new 52 week low at 10565. Friday didn’t come close to that low, another sign of an impending bounce.
Let’s review Friday’s closing technical indicators to see if Tuesday is set for a bounce.
Stock Market Outlook Chart Comments At The Close on Fri Jun 17 2022
On Friday the closing candlestick is bearish but also pointing to a high probability of a bounce. The candlestick indicates the index is oversold.
The Upper Bollinger Band is climbing higher and is above the 200 day moving average which is usually bullish in a bear market. The lower Bollinger Band is falling which is bearish but also points to a high probability of a bounce.
Any bounce though has to recover above 4100 if it is to turn into a rally and not just a bounce. That is unlikely, which is why the outlook remains lower after any bounce ends. This also means though that a strong bounce can be used to buy SPY put or ultra bear ETF shares to benefit from the next decline but I plan to wait at least a couple of days to see if the bounce can last longer than a day.
The 200, 100, 50 and 21 day moving averages are all falling lower and the 200 day is leading the market lower. This is bearish. The 21 day is now below 4000 which is bearish. A bounce over the next few days could see the index try to recover to at least 3950.
There are 4 down signals still in place and there have been no up signals since the start of April.
The chart is 85% bearish for Tuesday but a bounce is expected from the market being deeply oversold.

Stock Market Outlook review of Fri Jun 17 2022
Stock Market Outlook: Technical Indicators Review:
Momentum: Momentum is rising and negative. It is signaling oversold.
- Settings: For momentum I use a 10 period when studying market direction.
MACD Histogram: MACD (Moving Averages Convergence / Divergence) issued a down signal on Monday June 13. On Friday the down signal is still quite strong. The MACD histogram is also very negative.
- Settings: For MACD Histogram, I am using the Fast Points set at 13, Slow Points at 26 and Smoothing at 9.
Ultimate Oscillator: The Ultimate Oscillator is rising and oversold.
- Settings: The Ultimate Oscillator settings are: Period 1 is 5, Period 2 is 10, Period 3 is 15, Factor 1 is 4, Factor 2 is 2 and Factor 3 is 1. These are not the default settings but are the settings I use with the S&P 500 chart set for 1 to 3 months.
Slow Stochastic: The Slow Stochastic has an up signal in place and is oversold.
Settings: For the Slow Stochastic I use the K period of 14 and D period of 3. The Slow Stochastic tries to predict the market direction further out than just one day.
Relative Strength Index: The RSI signal is rising and oversold.
- Settings: The relative strength index is set for a period of 5 which gives it 5 days of market movement to monitor. It is often the first indicator to show an overbought or oversold signal.
Rate of Change: The rate of change signal is rising.
- Settings: Rate Of Change is set for a 21 period. This indicator looks back 21 days and compares price action from the past to the present. With the Rate Of Change, prices are rising when signals are positive. Conversely, prices are falling when signals are negative. As an advance rises the Rate Of Change signal should also rise higher, otherwise the rally is suspect. A decline should see the Rate Of Change fall into negative signals. The more negative the signals the stronger the decline.
Support and Resistance Levels To Be Aware Of:
4200 is light resistance
4150 is light resistance
4100 is light resistance
4050 is light resistance
4025 is light resistance
4000 is strong resistance
3975 is light resistance and is a decline of 17.5%
3900 is light resistance and is a decline of 19%
3850 is good support and is a decline of 20%
3825 is light support
3800 is good support.
3775 is light support
3750 is light support
3730 is light support
3700 is good support
3675 is light support
3650 is light support
3625 is light support
3600 is good support and is a decline of 25%
Stock Market Outlook for Tomorrow – Tue Jun 21 2022
For Tuesday, the technical indicators are showing strong indications that the market will try for a second bounce from being very oversold. This bounce could last longer than a single day.
On Friday, as outlined, I bought SPY Calls in the Market Direction Portfolio. These are still being held.
Potential Market Moving Events
Fed Chair Powell testifies Wednesday and Thursday this week. It is not expected for anything new to be released.
Tuesday:
10:00 Existing home sales
Wednesday:
9:30 Fed Chair Powell testifies at Senate Baking Committee
Thursday:
8:30 Weekly Initial Unemployment Insurance Claims
10:00 Fed Chair Powell testifies at House Financial Services Committee
Friday:
10:00 University of Michigan consumer index
10:00 5 year inflation expectations
10:00 New Home Sales
Stock Market Outlook Archives
Stock Market Outlook for Fri Apr 26 2024 – Higher and Positive Close

Morning Investing Strategy Notes for Thu Apr 25 2024

Stock Market Outlook for Thu Apr 25 2024 – Weakness and Lower

Morning Investing Strategy Notes for Wed Apr 24 2024
Stock Market Outlook for Wed Apr 24 2024 – Some Weakness But Higher Close

Morning Investing Strategy Notes for Tue Apr 23 2024
Stock Market Outlook for Tue Apr 23 2024 – Bounce But Lower

Morning Investing Strategy Notes for Mon Apr 22 2024
Stock Market Outlook for Mon Apr 22 2024 – No Change – Deeply Oversold Bounce Possible

Morning Investing Strategy Notes for Fri Apr 19 2024
Stock Market Outlook for Fri Apr 19 2024 – Deeply Oversold – Bounce Likely – Higher Close

Morning Investing Strategy Notes for Thu Apr 18 2024
Stock Market Outlook for Thu Apr 18 2024 – Deeply Oversold – Bounce Attempt Expected
Morning Investing Strategy Notes for Wed Apr 17 2024
Stock Market Outlook for Wed Apr 17 2024 – Another Bounce Attempt
