
The Stock Market Outlook for Wednesday was for the index to close slightly lower on Wednesday. As well, there were signs that Friday could also be slightly lower.
Stock Market Outlook Chart Comments At The Close on Wed Sep 12 2018
The S&P during the day slipped almost to the 21 day moving average once again. This is the fifth dip down to the 21 day and it has managed to hold up the market and keep it from slipping below the 21 day. However the candlestick on Wednesday at the close is bearish for Thursday which means another dip to the 21 day moving average could occur. Overall though the 21 day is still climbing.
All the other major moving averages are still climbing which is bullish and the 50 day is starting to rise away from the Lower Bollinger Band which is bullish.

Stock Market Outlook review of Wed Sep 12 2018
Stock Market Outlook: Technical Indicators Review:
Momentum: Momentum is negative but is unchanged from Tuesday’s close.
- Settings: For momentum I use a 10 period when studying market direction.
MACD Histogram: MACD (Moving Averages Convergence / Divergence) issued a down signal on Thu Sep 6 2018. The down signal was still strong on Wednesday.
- Settings: For MACD Histogram, I am using the Fast Points set at 13, Slow Points at 26 and Smoothing at 9.
Ultimate Oscillator: The Ultimate Oscillator signal is positive and rising.
- Settings: The Ultimate Oscillator settings are: Period 1 is 5, Period 2 is 10, Period 3 is 15, Factor 1 is 4, Factor 2 is 2 and Factor 3 is 1. These are not the default settings but are the settings I use with the S&P 500 chart set for 1 to 3 months.
Slow Stochastic: The Slow Stochastic has an up signal in place. As the Slow Stochastic looks out beyond a day, the up signal might be advising that it will be a couple of days yet before the market moves higher.
- Settings: For the Slow Stochastic I use the K period of 14 and D period of 3. The Slow Stochastic tries to predict the market direction further out than just one day.
Relative Strength Index: The RSI signal is rising.
- Settings: The relative strength index is set for a period of 5 which gives it 5 days of market movement to monitor. It is often the first indicator to show an overbought or oversold signal.
Rate of Change: The rate of change signal is rising.
- Settings: Rate Of Change is set for a 21 period. This indicator looks back 21 days and compares price action from the past to the present. With the Rate Of Change, prices are rising when signals are positive. Conversely, prices are falling when signals are negative. As an advance rises the Rate Of Change signal should also rise higher, otherwise the rally is suspect. A decline should see the Rate Of Change fall into negative signals. The more negative the signals the stronger the decline.
Support Levels To Be Aware Of:
2830 is light support
2795 is light support
2745 to 2750 is light support
2725 is light support.
2700 is support.
2675 is light support.
2650 is light support
2620 is light support
2600 is strong support.
There is good support at the 2550 level from where the market bounced back from the recent correction low on Feb 9.
The S&P has light support at 2480. It also has light support at 2450 and good support at 2425. Below that there is some support at 2400, 2380, 2350. 2300 has the most support at present but would represent a full correction as a drop to this level would be 20% and just 5% away from a potential bear market signal.
Stock Market Outlook for Tomorrow – Thu Sep 13 2018
For Thu Sep 13 2018 the S&P technical indicators have improved. Particularly important is the up signal generated Wednesday at the close from the Slow Stochastic.
While MACD still points down, there have been no increases in the strength of that down signal.
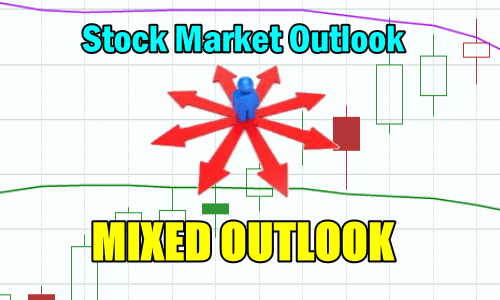
The biggest concern for Thursday is the bearish candlestick. Thursday’s outlook is mixed. There are signals advising that another slightly negative close should be expected just as there are signals that a slightly positive day should be expected.
Overall there are more signals pointing to a positive day for Thursday, than a negative one. Remember though, there were signals Tuesday after the close that pointed to a lower end to the week.
Stock Market Outlook Archives
Stock Market Outlook for Fri Apr 26 2024 – Higher and Positive Close

Morning Investing Strategy Notes for Thu Apr 25 2024

Stock Market Outlook for Thu Apr 25 2024 – Weakness and Lower

Morning Investing Strategy Notes for Wed Apr 24 2024
Stock Market Outlook for Wed Apr 24 2024 – Some Weakness But Higher Close

Morning Investing Strategy Notes for Tue Apr 23 2024
Stock Market Outlook for Tue Apr 23 2024 – Bounce But Lower

Morning Investing Strategy Notes for Mon Apr 22 2024
Stock Market Outlook for Mon Apr 22 2024 – No Change – Deeply Oversold Bounce Possible

Morning Investing Strategy Notes for Fri Apr 19 2024
Stock Market Outlook for Fri Apr 19 2024 – Deeply Oversold – Bounce Likely – Higher Close

Morning Investing Strategy Notes for Thu Apr 18 2024
Stock Market Outlook for Thu Apr 18 2024 – Deeply Oversold – Bounce Attempt Expected
Morning Investing Strategy Notes for Wed Apr 17 2024
Stock Market Outlook for Wed Apr 17 2024 – Another Bounce Attempt
