

The S&P on Thursday finally succumbed to the overbought market. All it took was some bad news from AT&T and earnings from two financial stocks to send the market lower. Losses though were small but the overbought market just needed a catalyst.
The direction is still up but no market can climb straight up forever without consolidate gains and Thursday saw the markets begin to work on consolidation.
S&P 500 Index Close
The S&P index ended down 4.31 to 2550.93
Dow Jones Index Close
The Dow Jones ended down 31.88 to 22,841.01
NASDAQ Index Close
The NASDAQ closed down 12.04 to 6591.51
Stock Market Outlook
Stock Market Outlook review of Thu Oct 12 2017
Chart Comments At The Close:
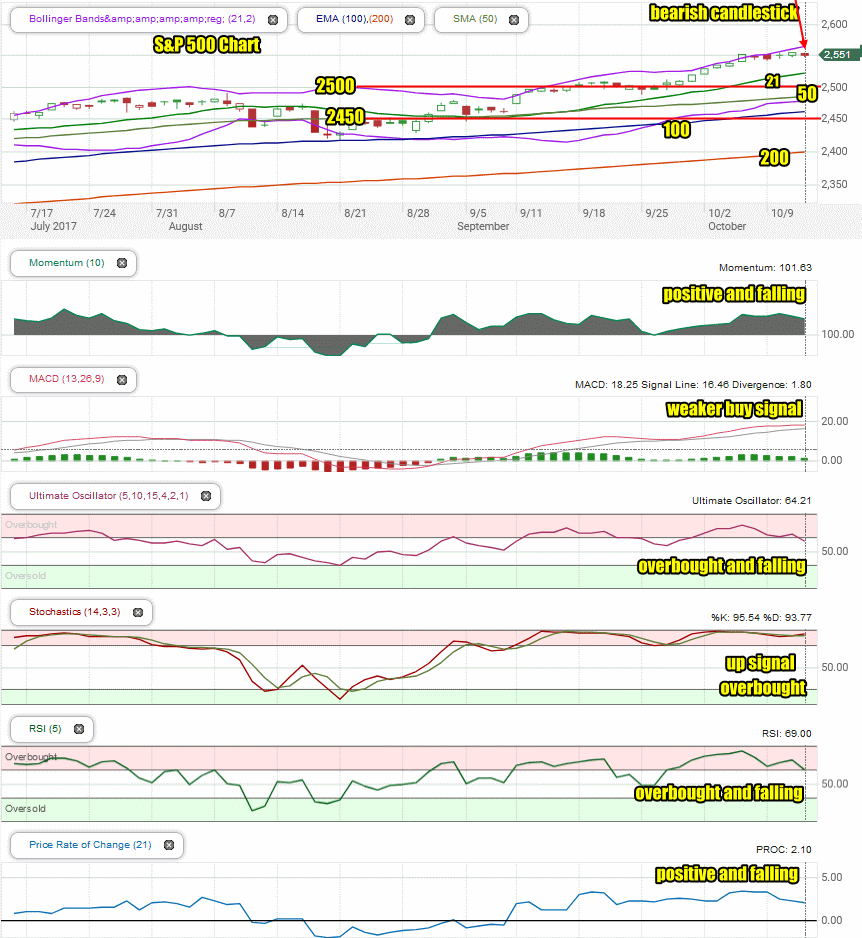
On Thursday the S&P slipped slightly although if you look at the chart you can see that the index is trending sideways and bumping up against the all-time highs.
The market left behind a bearish candlestick for Friday.
All the major moving averages and the 21 day moving average are moving higher which is bullish. The Upper Bollinger Band is also moving higher, again bullish for the market.
Stock Market Outlook: Technical Indicators:
Momentum: For momentum I use a 10 period when studying market direction. Momentum is positive but continuing to slip.
MACD Histogram: For MACD Histogram, I am using the Fast Points set at 13, Slow Points at 26 and Smoothing at 9. MACD (Moving Averages Convergence / Divergence) issued a buy signal on Aug 31. The buy signal is still eroding.
Ultimate Oscillator: The Ultimate Oscillator settings are: Period 1 is 5, Period 2 is 10, Period 3 is 15, Factor 1 is 4, Factor 2 is 2 and Factor 3 is 1. These are not the default settings but are the settings I use with the S&P 500 chart set for 1 to 3 months. The Ultimate Oscillator is positive, overbought and falling.
Slow Stochastic: For the Slow Stochastic I use the K period of 14 and D period of 3. The Slow Stochastic tries to predict the market direction further out than just one day. The Slow Stochastic is extremely overbought. It has a bit stronger up signal in place for Friday.
Relative Strength Index: The relative strength index is set for a period of 5 which gives it 5 days of market movement to monitor. It often is the first indicator to show an overbought or oversold signal. The RSI signal is showing the market is still overbought.
Rate of Change: Rate Of Change is set for a 21 period. This indicator looks back 21 days and compares price action from the past to the present. The rate of change signal is positive but falling back which normally indicates lower prices lie ahead for the S&P..
Support Levels To Be Aware Of:
The S&P has light support at 2480. It has light support at 2450 and good support at 2425. There is also light support at 2400, 2380, 2350 and 2300.
Stock Market Outlook for Tomorrow – Fri Oct 13 2017
Signs continue that the market is under pressure and weakness is continuing to build. Despite this there are no clear sell or down signals in the market.
The Slow Stochastic issued an up signal for Friday which is good for the bulls.
However overall, the dip on Thursday needs more time to work out the overbought condition on the market.
Weakness should continue Friday but the rally itself is still intact. A lower close is possible.
Stay FullyInformed With Email Updates
Market Direction Internal Links
Profiting From Understanding Market Direction (Articles Index)
Understanding Short-Term Signals
Market Direction Portfolio Trades (Members)
Market Direction External Links
IWM ETF Russell 2000 Fund Info
Market Direction SPY ETF 500 Fund Info