
Thursday saw another day of a couple of deep dips but a higher close for the S&P.
The markets continue to show resilience as investors remain convinced a trade deal with China is near.
Stock Market Outlook Chart Comments At The Close on Thu Nov 14 2019
The SPX chart is bullish for Friday. The closing candlestick on Thursday is bullish for Friday.
3030 is light support. All the major moving averages are climbing including the 50 and 21 day moving averages. The 21 day moving average is still rising above the 3030 level which is bullish. The 50 day is above the 3000 level which is also bullish.
The Lower Bollinger Band has moved above the 100 day moving average which is bullish.
The two buy signals from September are still in place.
Overall the chart remains bullish but you can clearly see the index is moving primarily sideways for the past week.

Stock Market Outlook review of Thu Nov 14 2019
Stock Market Outlook: Technical Indicators Review:
Momentum: Momentum is positive and moving sideways.
- Settings: For momentum I use a 10 period when studying market direction.
MACD Histogram: MACD (Moving Averages Convergence / Divergence) issued an up signal on Tue Oct 15 2019. The up signal was weaker again on Thursday but still present.
- Settings: For MACD Histogram, I am using the Fast Points set at 13, Slow Points at 26 and Smoothing at 9.
Ultimate Oscillator: The Ultimate Oscillator signal is positive and rising.
- Settings: The Ultimate Oscillator settings are: Period 1 is 5, Period 2 is 10, Period 3 is 15, Factor 1 is 4, Factor 2 is 2 and Factor 3 is 1. These are not the default settings but are the settings I use with the S&P 500 chart set for 1 to 3 months.
Slow Stochastic: The Slow Stochastic is extremely overbought and has a neutral signal in place.
- Settings: For the Slow Stochastic I use the K period of 14 and D period of 3. The Slow Stochastic tries to predict the market direction further out than just one day.
Relative Strength Index: The RSI signal is overbought and moving sideways.
- Settings: The relative strength index is set for a period of 5 which gives it 5 days of market movement to monitor. It is often the first indicator to show an overbought or oversold signal.
Rate of Change: The rate of change signal is moving sideways which indicates not much change in prices is expected.
- Settings: Rate Of Change is set for a 21 period. This indicator looks back 21 days and compares price action from the past to the present. With the Rate Of Change, prices are rising when signals are positive. Conversely, prices are falling when signals are negative. As an advance rises the Rate Of Change signal should also rise higher, otherwise the rally is suspect. A decline should see the Rate Of Change fall into negative signals. The more negative the signals the stronger the decline.
Support and Resistance Levels To Be Aware Of:
3100 is resistance
3030 in light support
3000 is support
2960 is light support
2950 was light support
2900 is light support
2860 is light support
2840 is support
2800 is strong support
2795 is light support
2745 to 2750 is light support
2725 is light support
2700 is light support
Stock Market Outlook for Tomorrow – Fri Nov 15 2019
The technical indicators continuing to show some weakness but on Thursday by the close, none are indicating a lower move should be expected for Friday.
Instead the outlook is still for stocks to move primarily sideways and continue to try to grind higher.
A final day of testimony from Powell did not disrupt stocks and neither did negative economic data out of China. Instead the index continues to take any negative news in its stride as investors remains convinced a trade deal is near with China.
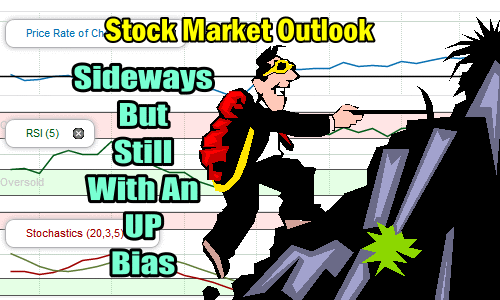
For Friday the outlook is still sideways with a growing bias to the upside.
Stock Market Outlook Archives
Stock Market Outlook for Fri Apr 26 2024 – Higher and Positive Close

Morning Investing Strategy Notes for Thu Apr 25 2024

Stock Market Outlook for Thu Apr 25 2024 – Weakness and Lower

Morning Investing Strategy Notes for Wed Apr 24 2024
Stock Market Outlook for Wed Apr 24 2024 – Some Weakness But Higher Close

Morning Investing Strategy Notes for Tue Apr 23 2024
Stock Market Outlook for Tue Apr 23 2024 – Bounce But Lower

Morning Investing Strategy Notes for Mon Apr 22 2024
Stock Market Outlook for Mon Apr 22 2024 – No Change – Deeply Oversold Bounce Possible

Morning Investing Strategy Notes for Fri Apr 19 2024
Stock Market Outlook for Fri Apr 19 2024 – Deeply Oversold – Bounce Likely – Higher Close

Morning Investing Strategy Notes for Thu Apr 18 2024
Stock Market Outlook for Thu Apr 18 2024 – Deeply Oversold – Bounce Attempt Expected
Morning Investing Strategy Notes for Wed Apr 17 2024
Stock Market Outlook for Wed Apr 17 2024 – Another Bounce Attempt
