FullyInformed.com
Generic filters
Exact matches only
Search in title
Search in content
Search in excerpt

Stock Market Outlook For Fri Jun 12 2026 – Bounce and Higher

Jun 12, 2026 | Stock Market Outlook


Prior Trading Day Summary

On Thu Jun 11 2026 stocks roared back after President Trump announced a deal was close with Iran to end the conflict. Oil prices fell on the news and stocks shot higher.

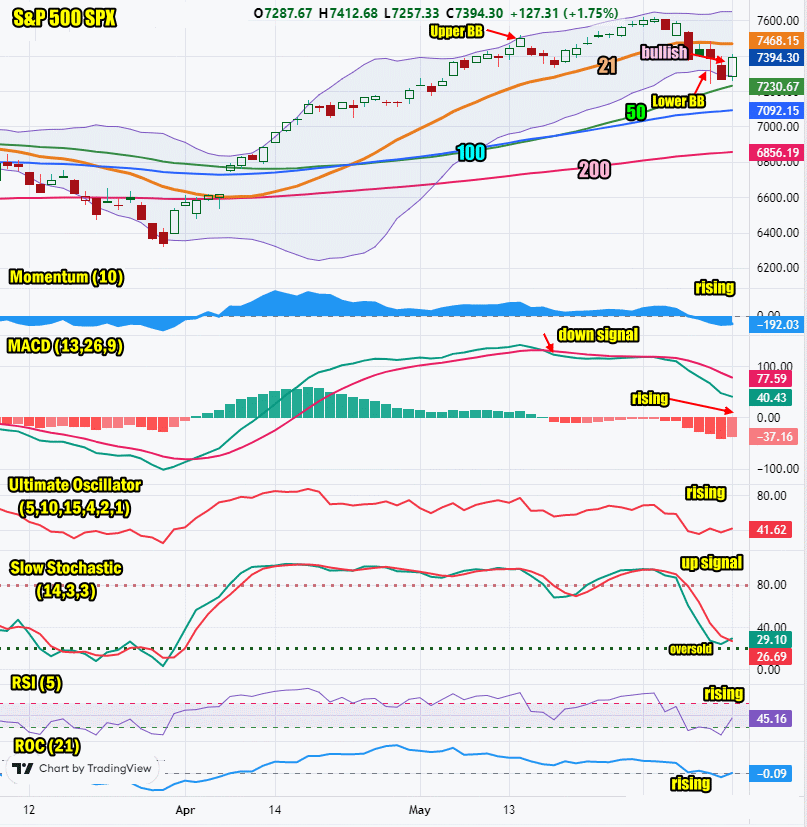
The S&P soared 127 points to end the day at 7394. Volume rose to 5.8 billion shares traded with 75% of all volume being traded higher intraday. By the close 70% of stocks were rallying on the SPX.

The NASDAQ jump 640 points which returned the index to a positive 100 points on the week. Volume rose to 10.5 billion shares with 68% of all stocks rising by the close.

With the SPACEX IPO due on Friday, the outlook looks steady for a higher day.

Let’s review the closing technical indicators from Thu Jun 11 2026 to see what they predict for Fri Jun 12 2026.


Stock Market Outlook: SPX Closing Chart For Thu Jun 11 2026 

The index closed below the 21 day moving average but above the Lower Bollinger Band. While this is still bearish the bounce on Thursday looks to have staying power for Friday.

The closing candlestick is bullish for Friday.

The 21 day moving average is unchanged and closed at 7468. This is neutral.

The 50 day moving average is rising and closed at 7230. This is bullish.

The 100 day moving average is rising and closed at 7092. This is bullish.

The 200 day moving average is rising and closed at 6856. This is bullish.

The Lower Bollinger Band is falling which is bearish. The Upper Bollinger Band is heading higher which is also bearish. after the bounce on Thursday the outlook is for the index to continue to climb.

The SPX chart is more bullish than bearish for Fri Jun 12 2026.

SPX Stock Market Outlook review of Thu Jun 11 2026


Stock Market Outlook: Technical Indicators Review

Momentum: Momentum is rising and negative. This is bearish.

  • Settings: For momentum I use a 10 period when studying market direction.
MACD Histogram: MACD (Moving Averages Convergence / Divergence) issued a down signal on Tue May 19 2026. On Thu Jun 11 2026 the down signal lost strength.

  • Settings: For MACD Histogram, I am using the Fast Points set at 13, Slow Points at 26 and Smoothing at 9.
Ultimate Oscillator: The Ultimate Oscillator is rising and oversold. A move still higher is anticipated. This is bullish.

  • Settings: The Ultimate Oscillator settings are: Period 1 is 5, Period 2 is 10, Period 3 is 15, Factor 1 is 4, Factor 2 is 2 and Factor 3 is 1. These are not the default settings but are the settings I use with the S&P 500 chart set for 1 to 3 months.
Slow Stochastic: The Slow Stochastic has an up signal in place. It is oversold and at levels which a higher move is expected. This is bullish.

  • Settings: For the Slow Stochastic I use the K period of 14 and D period of 3. The Slow Stochastic tries to predict the market direction further out than just one day.
Relative Strength Index: The RSI signal is rising sharply and bullish.

  • Settings: The relative strength index is set for a period of 5 which gives it 5 days of market movement to monitor. It is often the first indicator to show an overbought or oversold signal.
Rate of Change: The rate of change is rising, signaling today will end higher.

Settings: Rate Of Change is set for a 21 period. This indicator looks back 21 days and compares price action from the past to the present. With the Rate Of Change, prices are rising when signals are positive. Conversely, prices are falling when signals are negative. As an advance rises, the Rate Of Change signal should also rise higher, otherwise the rally is suspect. A decline should see the Rate Of Change fall into negative signals. The more negative the signals the stronger the decline.


Stock Market Outlook: Support and Resistance Levels

7600 is resistance
7590 is resistance
7570 is resistance
7550 is resistance
7500 is resistance
7450 is resistance
7425 is resistance
7400 is resistance
7370 is resistance
7350 is resistance
7300 is support
7280 is support
7250 is support
7200 is support
7175 is support
7150 is support
7125 is support
7100 is good support
7050 is good support
7000 is stronger support


Stock Market Outlook for Fri Jun 12 2026 

The SPACEX IPO will be the primary focus of investors today. Worries about inflation are on the back burner after the rally on Thursday in the indexes. The outlook is for a higher close today.

For Friday chip stocks will participate to the upside as well.


Potential Economic and Political Market Moving Events

Monday:

no reports scheduled

Tuesday:

6:00 NFIB optimism index fell lower than estimated, to 95.3.

8:30 April trade balancewas better than estimated at -$55.9 billion better than the last reading of -$56.6 billion

10:00 Existing home sales for May were stronger than estimated at 4.17 million, up from 4.02 million prior

10:00 Wholesale inventories for April were better than estimated coming in at 0.6% but still below the 1.5% reading from the last report

Wednesday:

8:30 CPI for May is estimated to fall slightly to 0.5% from 0.6% prior

8:30 CPI year-over-year is estimated to jump to 4.2% from 3.8% prior

8:30 Core CPI for May is estimated to fall to 0.3% from 0.4% prior

8:30 Core CPI year-over-year is estimated to rise to 2.9% from 2.8%

2:00 Monthly federal budget is estimated at -$292 billion versus -$316 billion prior

Thursday:

8:30 Weekly Initial Unemployment Insurance Claims for June 6 were higher than estimated, coming in at 229,000

8:30 Producer Price Index for May was higher than estimated, coming in at 1.1%

8:30 Core PPI came in at 0.8% higher than estimated

8:30 PPI yea over year was higher than estimated, coming in at 6.5%

8:30 Core PPI year-over-year was quite higher than estimated, coming in at 5.1%

Friday:

No reports


Recent Outlooks

Morning Investing Strategy Notes for Thu Jun 11 2026

For FullyInformed Members the morning Investing Strategy Notes for Thu Jun 11 2026 review Wednesday’s plunge and trading action. Equities discussed today include Oracle Stock (ORCL), IWM ETF, Netflix Stock (NFLX), Walt Disney Stock (DIS), Adobe Stock (ADBE) and more …

Stock Market Outlook For Thu Jun 11 2026 – Oversold Bounce – Flat To Lower Close

Prior Trading Day Summary On Wed Jun 10 2026 stocks attempted to hold back sellers but when the early morning bounce failed, sellers took charge. By 2:00 a second rally was failing and stocks moved to new lows. The close …

Morning Investing Strategy Notes for Wed Jun 10 2026

For FullyInformed Members the morning Investing Strategy Notes for Wed Jun 10 2026 review Tuesday’s dramatic sell-off and equally surprising recovery. Equities discussed today include SPY ETF, Apple Stock (AAPL), IWM ETF, Eli Lilly Stock (LLY), Oracle Stock (ORCL) and …

Stock Market Outlook For Wed Jun 10 2026 – All About The Inflation Reports

Prior Trading Day Summary On Tue Jun 9 2026 stocks had a wild day which saw significant losses only to find buyers return to send the indexes back up. The S&P fell to 7237 intraday and closed at 7386 down …

Morning Investing Strategy Notes for Tue Jun 9 2026

For FullyInformed Members the morning Investing Strategy Notes for Tue Jun 9 2026 look at the trading action on Monday and the lack of a strong bounce back after Friday’s sell-off. Equities discussed today include Eli Lilly Stock (LLY), Exxon …

Stock Market Outlook For Tue Jun 9 2026 – Choppy – Dips Likely But Higher

Prior Trading Day Summary On Mon Jun 8 2026 the market attempted a bounce but as the day wore on a lack of conviction saw buyers be selective and narrow the number of stocks they were buying. This meant by …

Morning Investing Strategy Notes for Mon Jun 8 2026

For FullyInformed Members the morning Investing Strategy Notes for Mon Jun 8 2026 review Friday’s major sell-off and the subsequent outlook for the start of the second week of June 2026.. Equities discussed today include GLD ETF SPDR® Gold Shares …

Stock Market Outlook For Mon Jun 8 2026 – Bounce Likely But Lower

Prior Trading Day Summary On Friday June 5 2026, stocks fell lead by a sharp decline in many high flying tech stocks thanks to a stronger Non-Farm Payroll Report on Friday which sent bond yields higher. It was a wild …

Morning Investing Strategy Notes for Fri Jun 5 2026

For FullyInformed Members the morning Investing Strategy Notes for Fri Jun 5 2026 look at the outlook for stocks today. Equities discussed today include Lululemon Athletica Stock (LULU), DocuSign Stock (DOCU), GLD ETF SPDR® Gold Shares (GLD) and more. The …

Stock Market Outlook For Fri Jun 5 2026 – All About The May Jobs Numbers

Prior Trading Day Summary On Thu Jun 4 2026 stocks opened the day lower but early dips found buyers and despite the technical readings showing stocks are due for a rest, investors snapped up some stocks while dumping a number …

Morning Investing Strategy Notes for Thu Jun 4 2026

For FullyInformed Members the morning Investing Strategy Notes for Thu Jun 4 2026 look at the possible outcome into the close. Equities discussed today include Crowdstrike Stock (CRWD), Caterpillar Stock (CAT), Broadcom Stock (AVGO), Five Below Stock (FIVE) and more …

Stock Market Outlook For Thu Jun 4 2026 – Choppy With Lower Close

Prior Trading Day Summary On Wed Jun 3 2026 stocks slid on the back of rising oil prices, an escalation of fighting in the Iran conflict and rising bond yields. The S&P lost 56 points to end the day at …

Morning Investing Strategy Notes for Wed Jun 3 2026

For FullyInformed Members the morning Investing Strategy Notes for Wed Jun 3 2026  look at the declining market breadth in the present rally. Equities discussed today include TQQQ ETF, Crowdstrike Stock (CRWD), Palo Alto Networks Stock (PANW), Alphabet Stock (GOOGL), …

Stock Market Outlook For Wed Jun 3 2026 – Weakness But Higher

Prior Trading Day Summary On Tue Jun 2 2026 stocks continued to push to new highs but market breadth and volumes continue to show weakness building. The S&P rose 9 points to end the day at 7609. Volume fell to …

Subscribe For The Latest News